Alerting on monitored groups
When you configure an alert, you select a single performance metric to be alerted on.
Nevertheless, if you make us of the "split by" function, this performance metric will be uniquely monitored for each element that is part of the "split by" function.
For example, if you monitor the RTT value for a specific Net-Tracer, you may want to distinguish between all Stations that are used to issue this Net-Tracer from.
So in this case, you will use the "split by Stations" option.
If you have 10 Stations targeting this Net-Tracer, it means that Kadiska will automatically monitor the RTT value for each combination of Station/Net-Tracer. In our case, you end up monitoring the same metric but in 10 different contexts.
The "monitored groups" is defined as the total number of contexts in which one metric will be monitored (10 in the previous example).
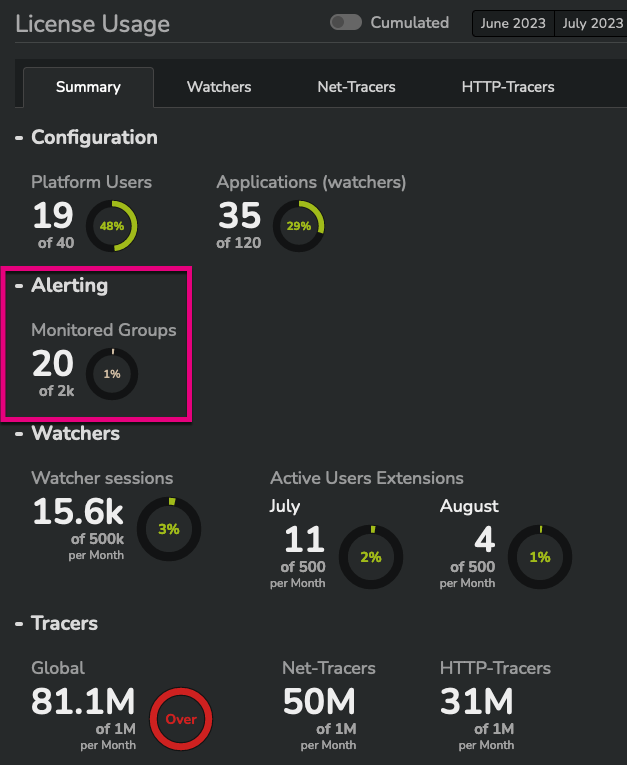
You can check the monitored groups license consumption by looking at the "License Usage" view ("Summary" tab) of the main configuration menu:
