News: January 2021
Navigation enhancements
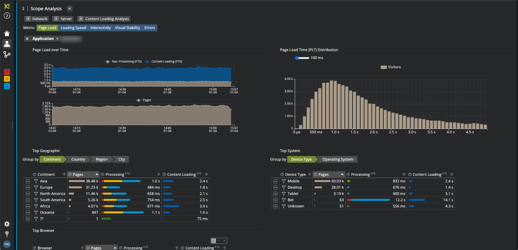
We have made the visual difference between the different diagnostic steps easier to understand and navigate. We have added new distribution graphs so that you understand immediately how many transactions occur within a satisfactory time frame vs not.
Net-Tracer improvements
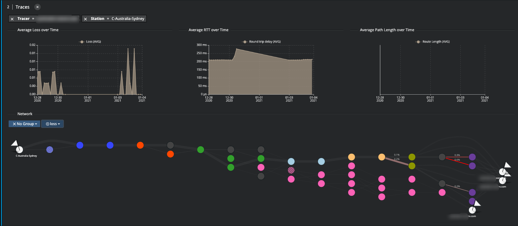
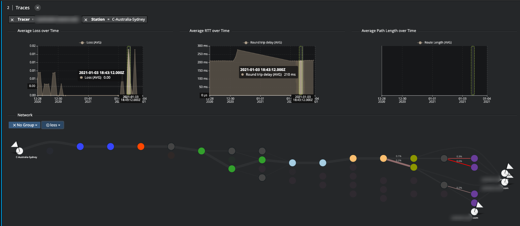
Kadiska now displays multiple targets in a single path visualization graph. This helps reflects the impact of load balancing and DNS resolution changes on the BGP path taken by your users.
Highlight route changes through time
It is now possible to highlight the routes taken at a given point of time to correlate events such as packet loss spikes and routes changes.
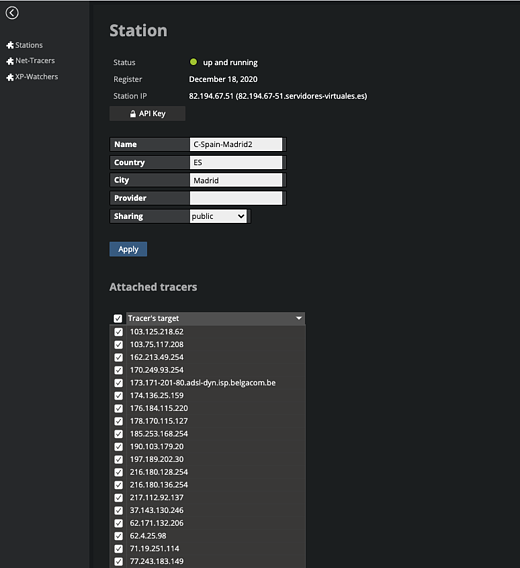
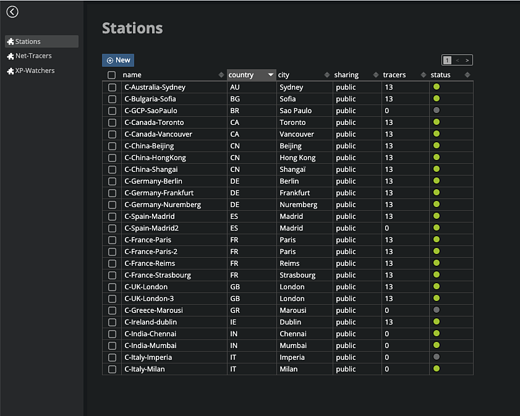
New configuration UI
The configuration interface is now integrated and visually aligned with the rest of the user interface.
Configure multiple objects at once
It is now possible to configure multiple stations and targets in a single action to speed up configuration changes through the UI.