Wait
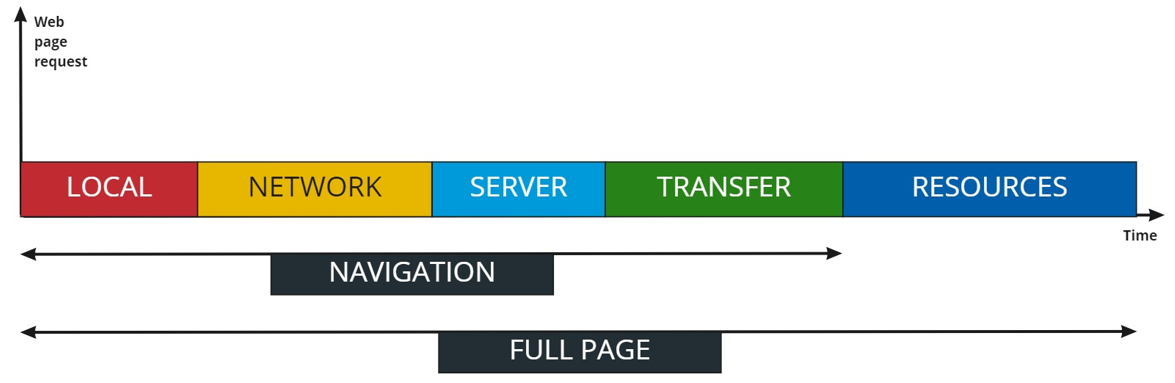
The process of loading a web page can be split into the following main steps:
- The browser processes the request locally, checking for local cached data for example, before performing any network request
- If the resource is not available locally, it is requested on the network
- The server receives the request and processes it
- The requested data are transferred from the server to the browser through the network
- The web page is being rendered on the user's browser
The Kadiska Wait metric is part of the first step. When a browser has to fetch a resource, it performs two basic checks before launching any request on the network:
- The browser checks if the resource is available locally in its cache
- If the resource is not available locally, the browser checks whether it is allowed to fetch the resource
The duration of the second step is mainly dependent on the following:
- HTTP protocol used
For example, in HTTP/1.1, most of the browsers cannot establish more than 6 concurrent TCP sessions to the same hostname/domain. When the browser reaches this limit, it has to wait for new available slots.
Please refer to our article "How HTTP/2 can boost web performance" for more details. - Higher priority requests
The browser may have to wait for render-blocking JS or CSS to be fetched and executed first before being allowed to proceed with other operations - Allocating space in the disk cache
During the brief disk cache space allocation process, the browser cannot perform any other task.
The time it takes for the browser to perform these basic checks corresponds to the Kadiska Wait metric.
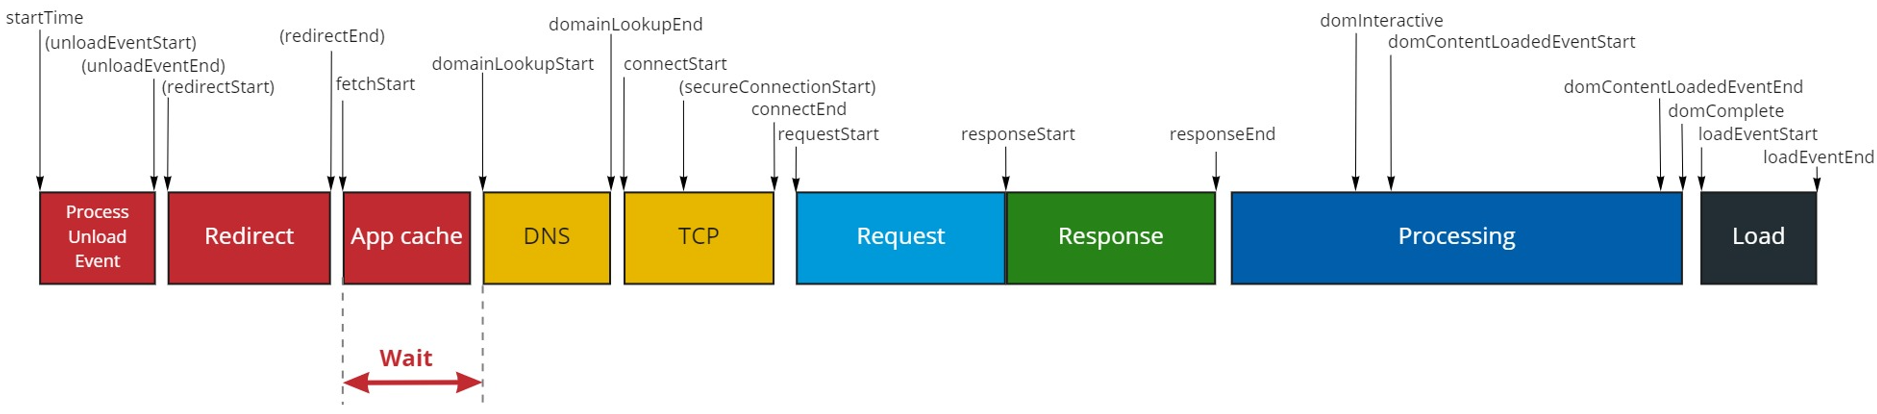
As shown on the W3C Time Navigation API view hereunder,
Wait time = domainLookupStart - fetchStart.
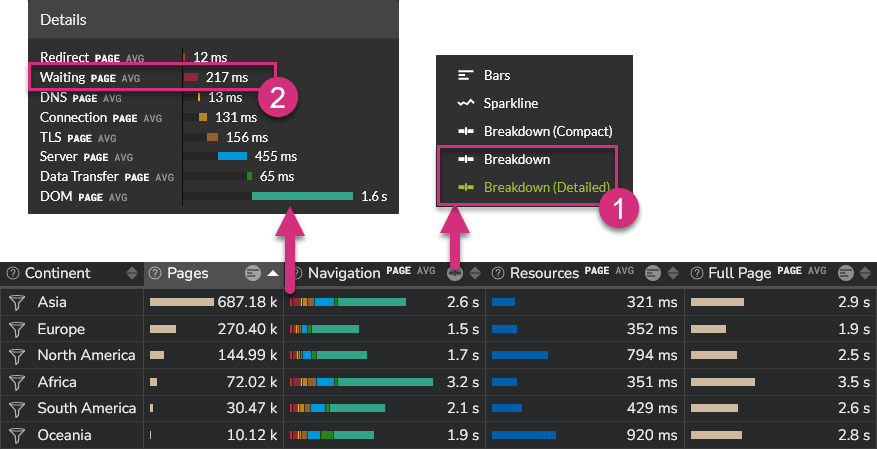
In the Kadiska interface, the waiting time is part of the Navigation and Resources metrics. These contain a Local part which includes this redirection time (Local time = Redirect time + Wait time).
In order to see the details between "Redirect" and "Wait" metrics, you must select either the "Breakdown" or the "Breakdown(Detailed)" view of the "Processing" measurement, as illustrated below.