Release Note: January 2023
New "User focus" dashboard
When a user complains about performance degradations, you want to be able to focus your analysis and quickly answer two important questions:
- What was the user's connectivity context during the degradation?
- Does the problem come from the user's device itself?
The new "User focus" dashboard specifically addresses these questions.
The following screenshot highlights this scenario:
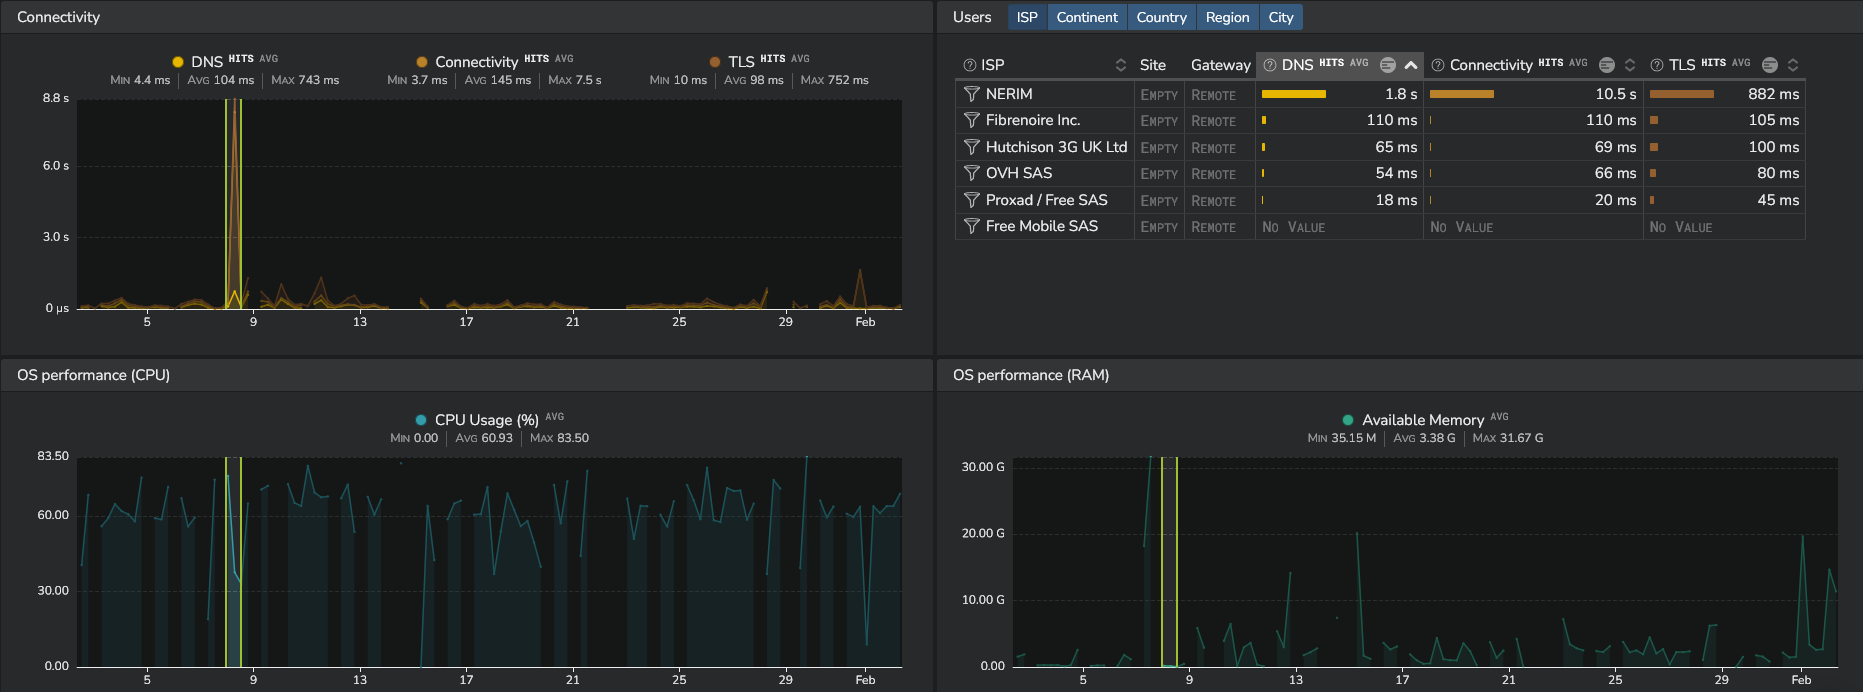
First, the "Connectivity" widget shows a big temporary network connectivity degradation.
By focusing on this peak (using the "focus mode"), you can instantly determine where the user resided and on which network(s) the user was connected during this selected time frame (widget "User" on the right).
In this example, you can see that the user was working remotely, and experienced bad network performances when connected on the "NERIM" ISP.
Next, you can determine whether the problem was caused by the end user's device itself by looking at the "OS performance (CPU)" and "OS performance (RAM)" widgets.
These respectively provide the average CPU usage and the quantity of available memory (RAM) on the device.
This dashboard can be used without filtering on a specific user. In this case though, CPU usage and available RAM values are averaged for all users.
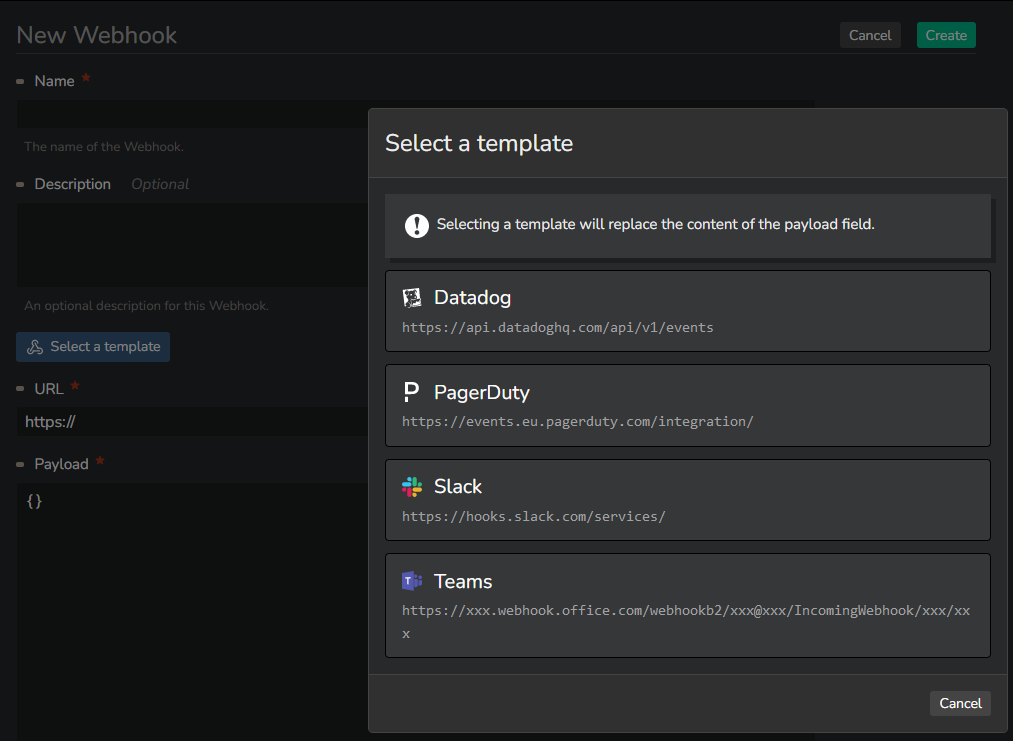
Webhook templates
Webhooks are used to send triggered alerts to third party platforms.
The content of the webhook must be provided in a JSON format. The structure is specific to each third-party service to integrate with.
In order to ease your configuration, we now propose templates (Datadog, PagerDuty, Slack and Microsoft Teams) you can directly select from the Kadiska interface.
New Net-Tracer consecutive tests interval
Net-Tracer tests are configurable and could be configured to be launched every 5, 10, 15, 20 and 30 minutes.
For organizations requiring even more granular data, we now support a 1 minute test interval!
This new interval is only available on the Enterprise Stations.
Managed Stations are configured by default to launch tests every 5 minutes.
Net-Tracers and SD-WAN overlay networks monitoring
So far, Net-Tracer test results that did not exceed two hops were simply ignored.
The reason was that we then assumed that an intermediate node (like a firewall) was simply dropping the test traffic.
In some cases though, this behavior is "normal" and the results should be considered to be valid. This is especially true in case of SD-WAN overlays monitoring when a VPN tunnel is used.
Kadiska now considered this behavior to be valid by default so that you can get end-to-end RTT measurements, even in such special monitoring scenario.
Enterprise Station ARM64 official support
The Kadiska Enterprise Station can now be deployed on an ARM64 architecture.