How to set up and configure a Fleet
Kadiska Testers can be deployed on Android, ChromeOS and Windows devices.
The Kadiska Fleet consists of a fleet of devices equipped with the Kadiska application (for Android and ChromeOS) or agent (for Windows) that allows you to perform different types of synthetic tests.
Deploying a Fleet is a three steps process.
First, you create the Fleet in the Kadiska platform and associate Tracer tests to it.
Next, you deploy the application/agent on the devices.
Finally, you apply the Fleet configuration to the devices on which the Kadiska application/agent is running.
Fleet creation
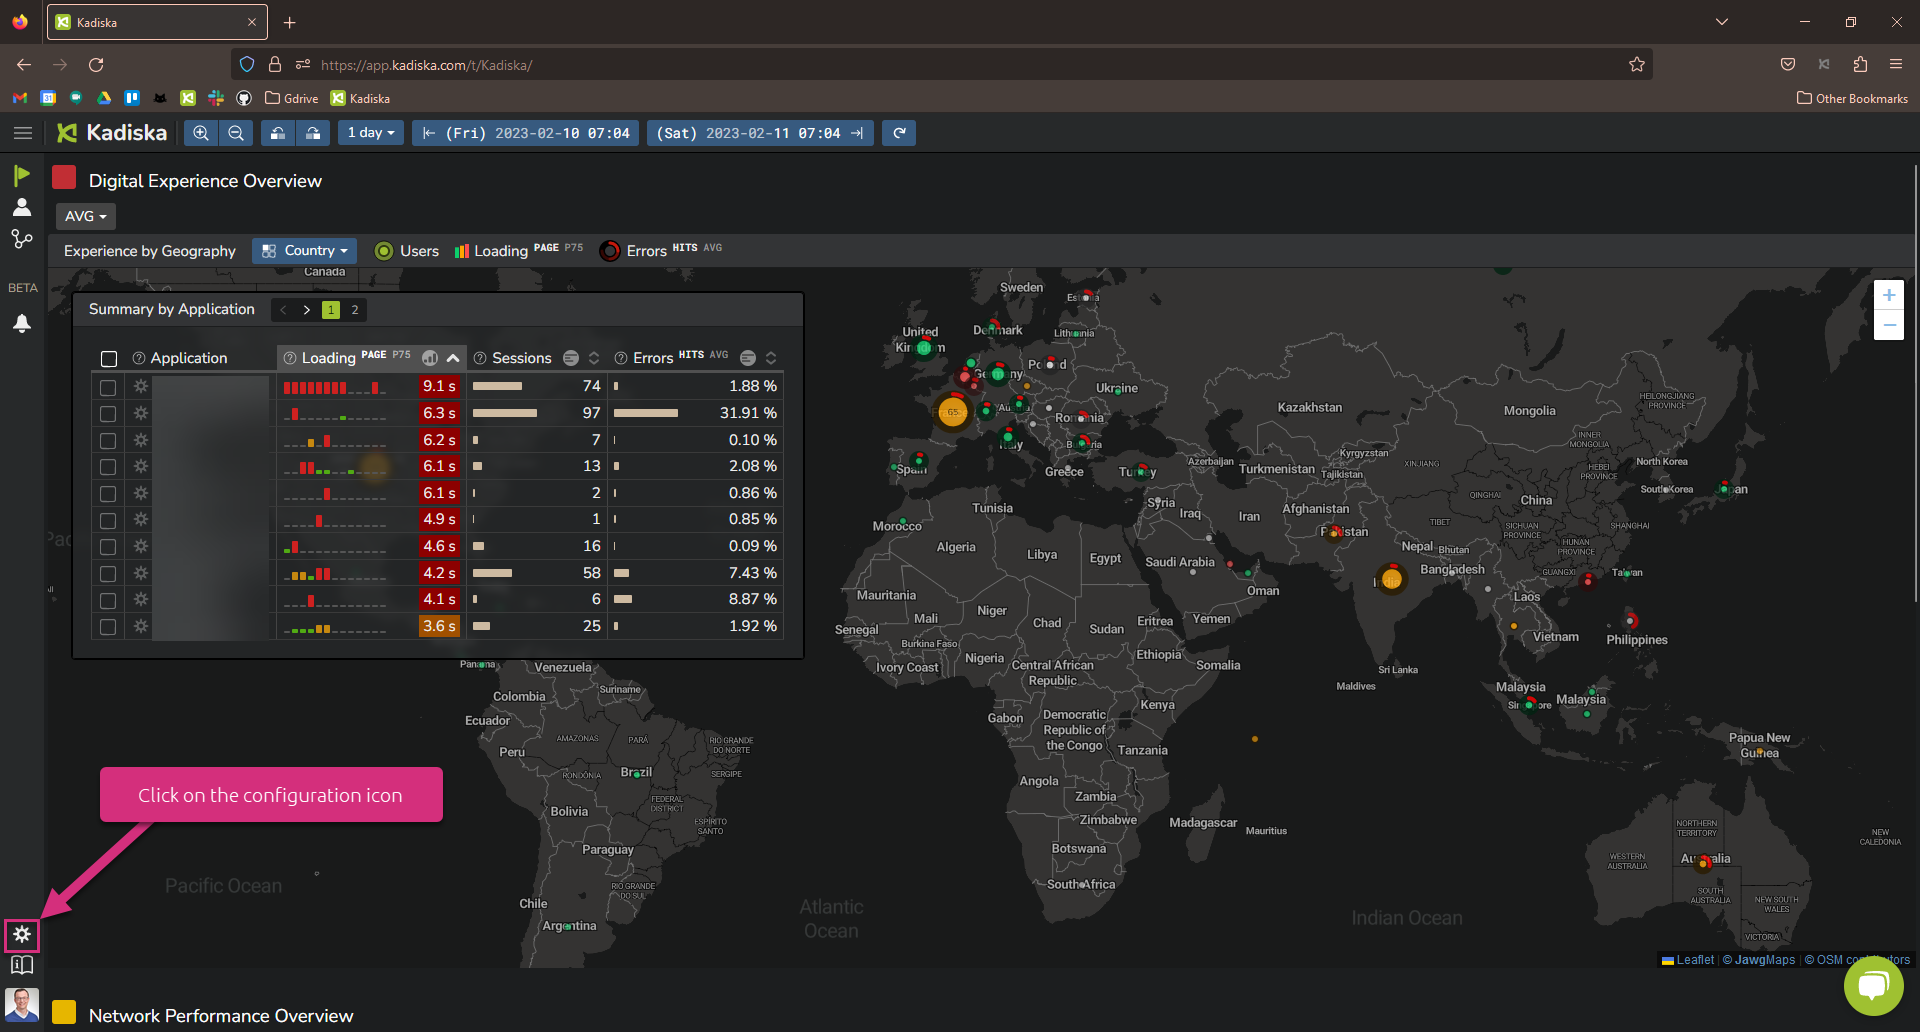
Once you have access to the Kadiska platform, login and click on the “Configuration” icon:
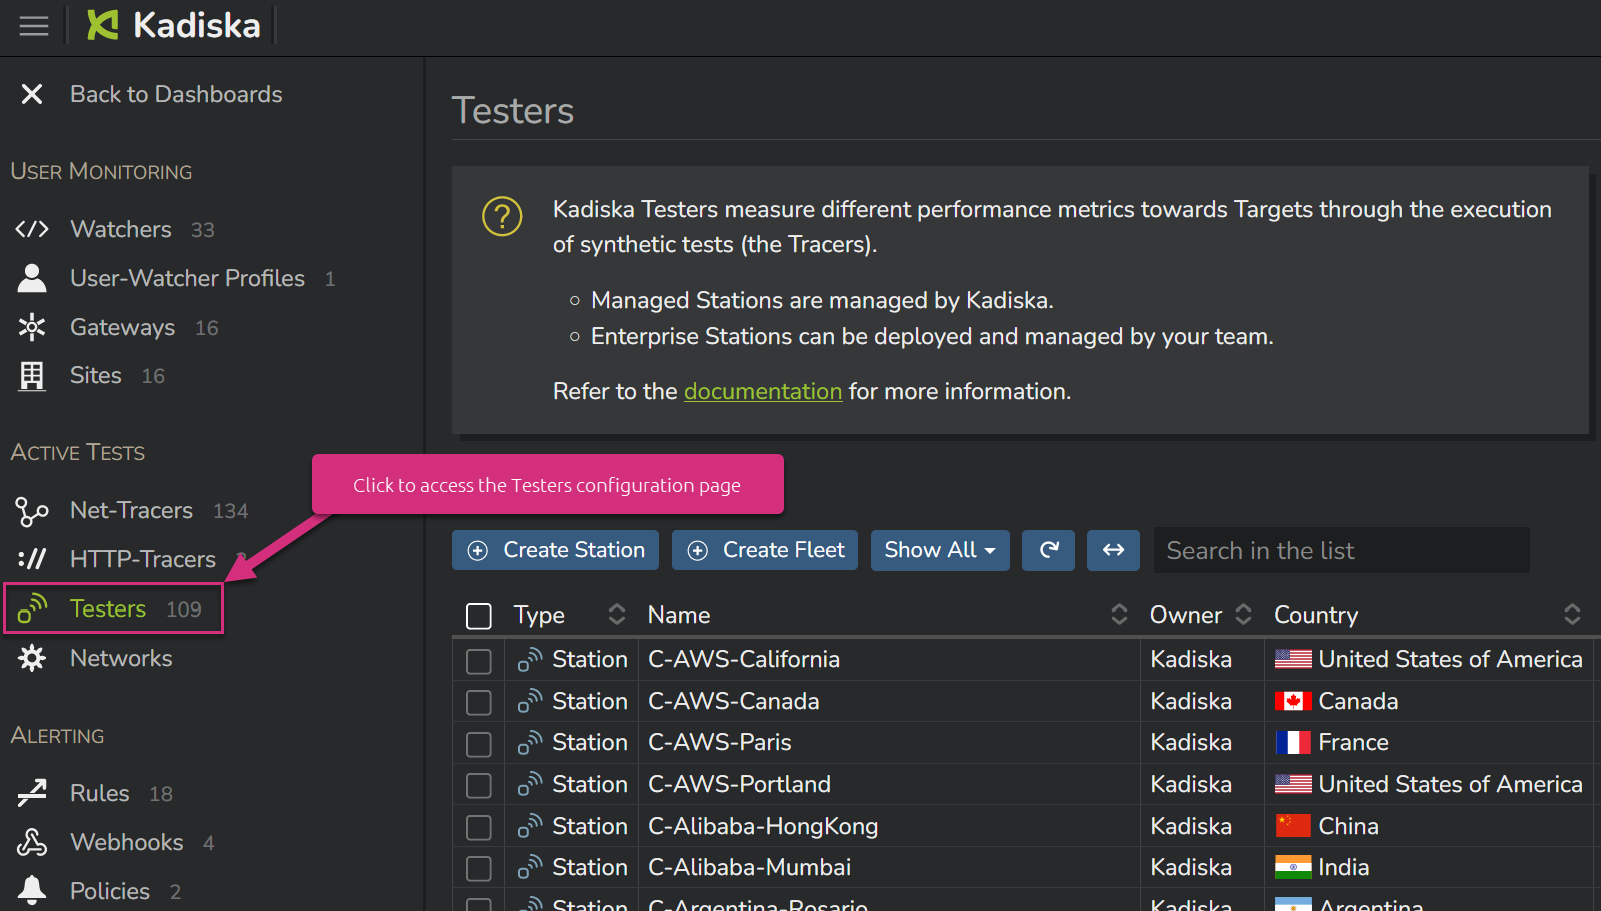
By default, you're directed to the "Watchers" configuration page. Click on "Testers" to go the Kadiska Testers configuration page.
On your screen, you may already see a list of managed Stations that we publicly provide access to.
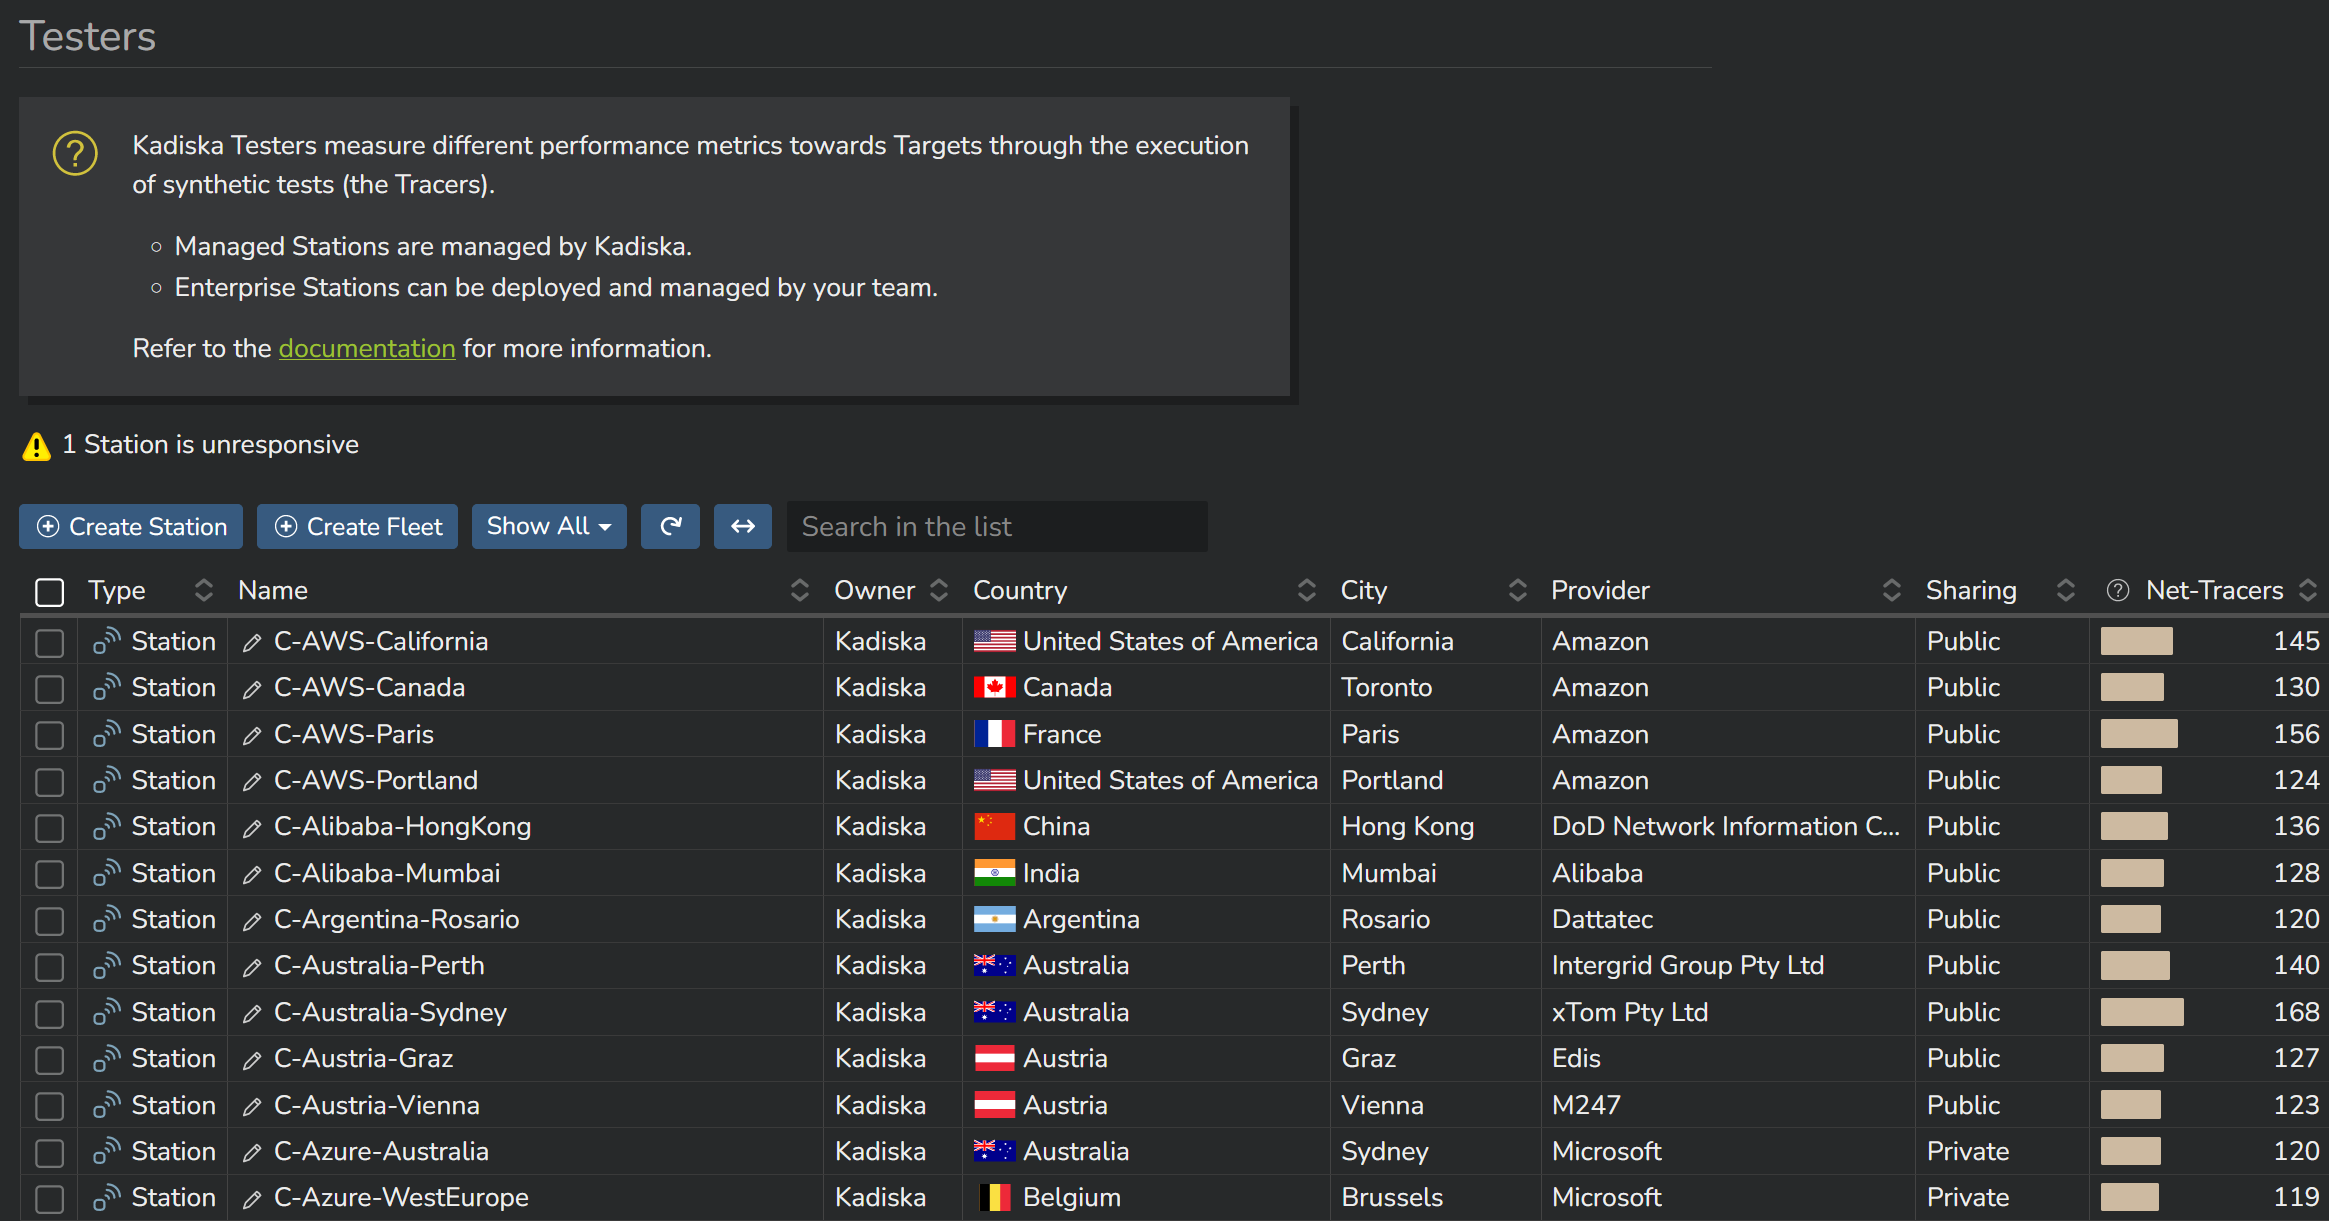
You can deploy your own Fleet(s) by first clicking on the button "Create Fleet".
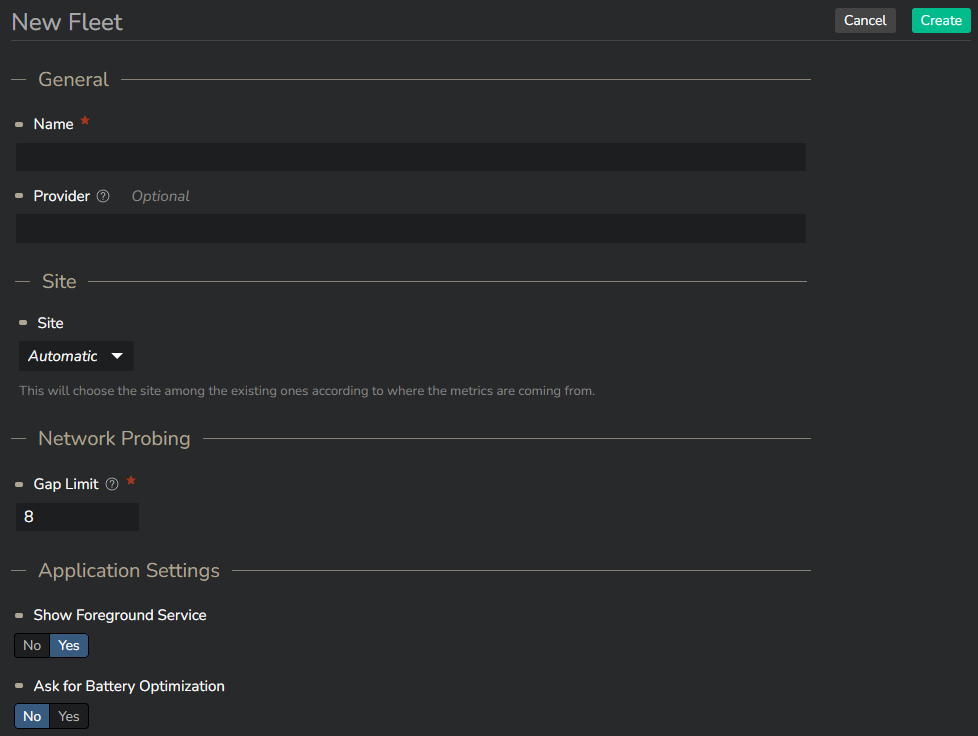
General section
As you can notice, creating a Fleet can be limited to providing a name!
The "Provider" is optional.
Site section
In case your Fleet is supposed to contain devices that remain on a specific location, you can link it to one of your configured sites.
In case you have not configured the site you need to link the Fleet to yet, then you can create a new one directly from the Fleet configuration menu.
Select "Assign a new site" from the dropdown list:
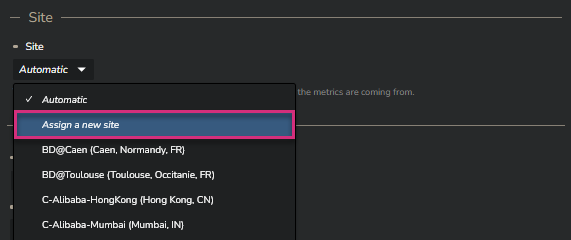
If the devices that will be part of the Fleet are supposed to move from one location to another, you can leave the site configuration to "Automatic", which is proposed by default.
In this case, the devices will be automatically located based on their dynamic IP addressing scheme and the existing sites and gateways configurations.
Please refer to the Sites and Gateways section for more information about the sites and the gateways.
Network Probing section
"Gap Limit" corresponds to the maximum number of consecutive hops that cannot be identified (no response to Tracer tests) before aborting the Tracer test. It prevents a Tracer from indefinitely try to reach a target that will never respond. The default value is 8. In case you are dealing with really complex network architectures, this value may need to be increased. The maximum value is 16.
If the Tracer does not discover any node and does not reach the target, no data will be reported in the Kadiska platform.
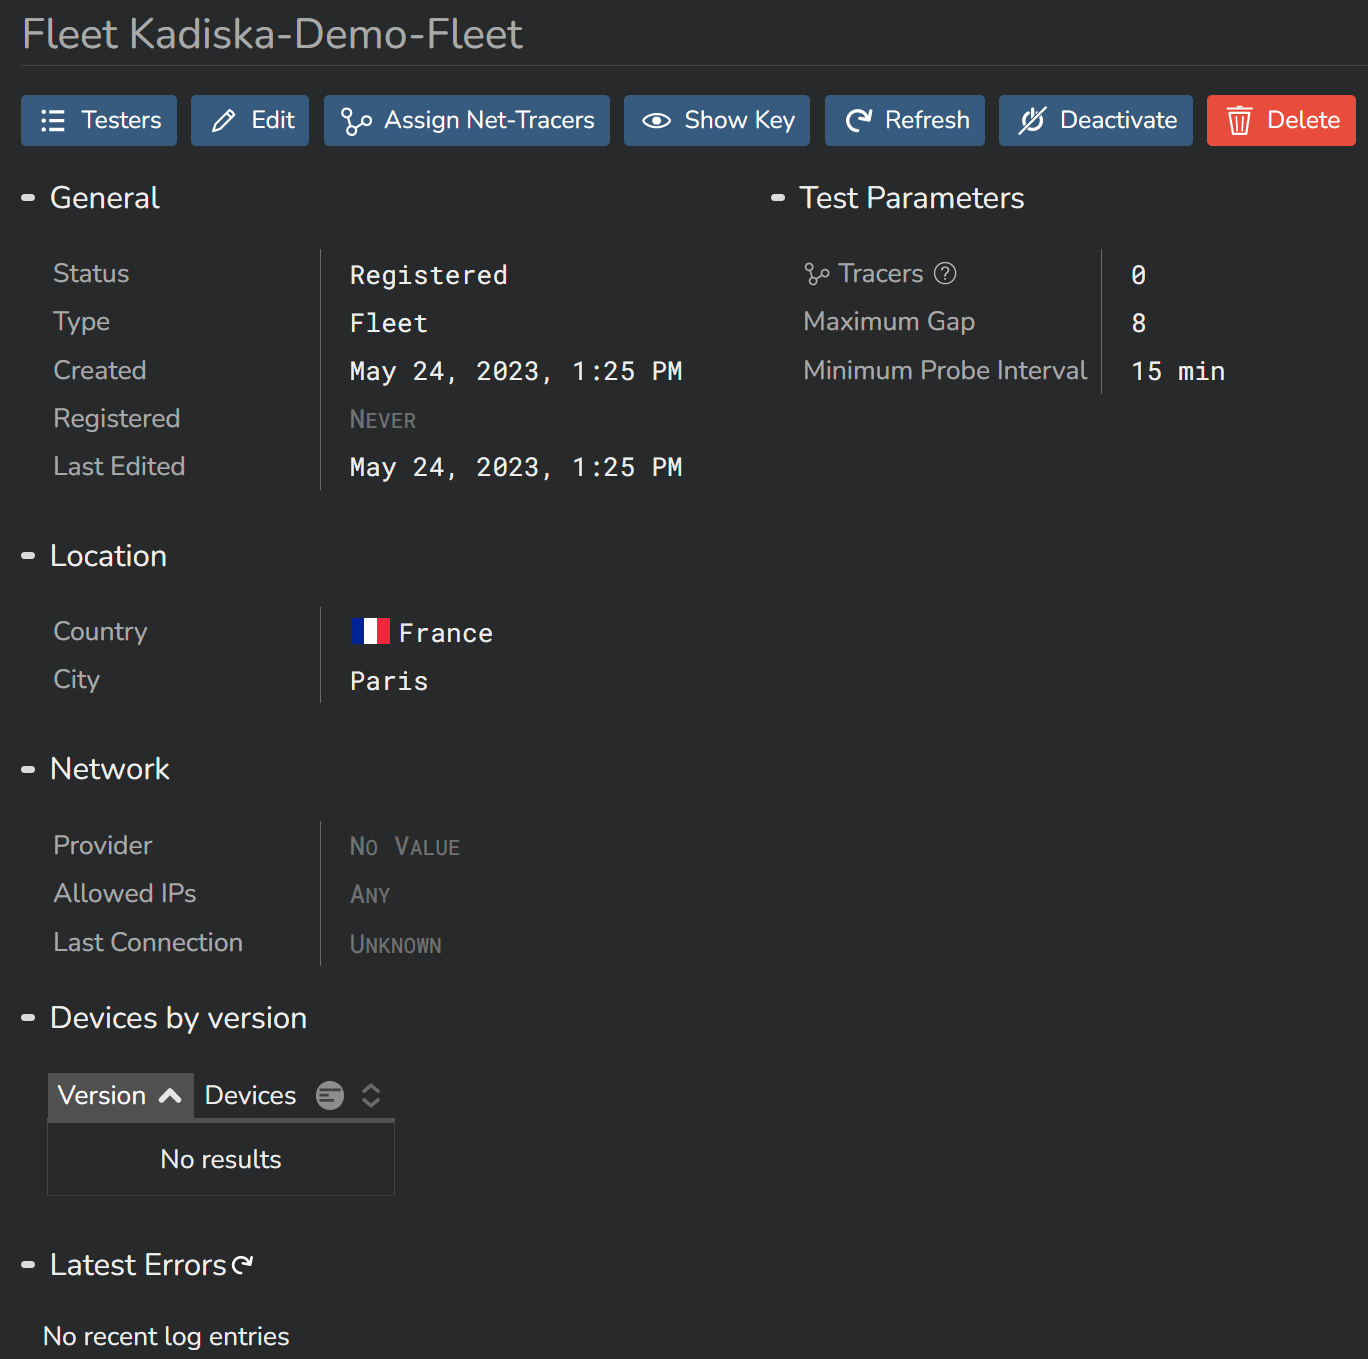
Click on "Create" to confirm your settings.
The Fleet is now created.
In order to associate Tracers to this Fleet, click on the "Assign Net-Tracers" button.
Instructions to assign Tracers are provided here.
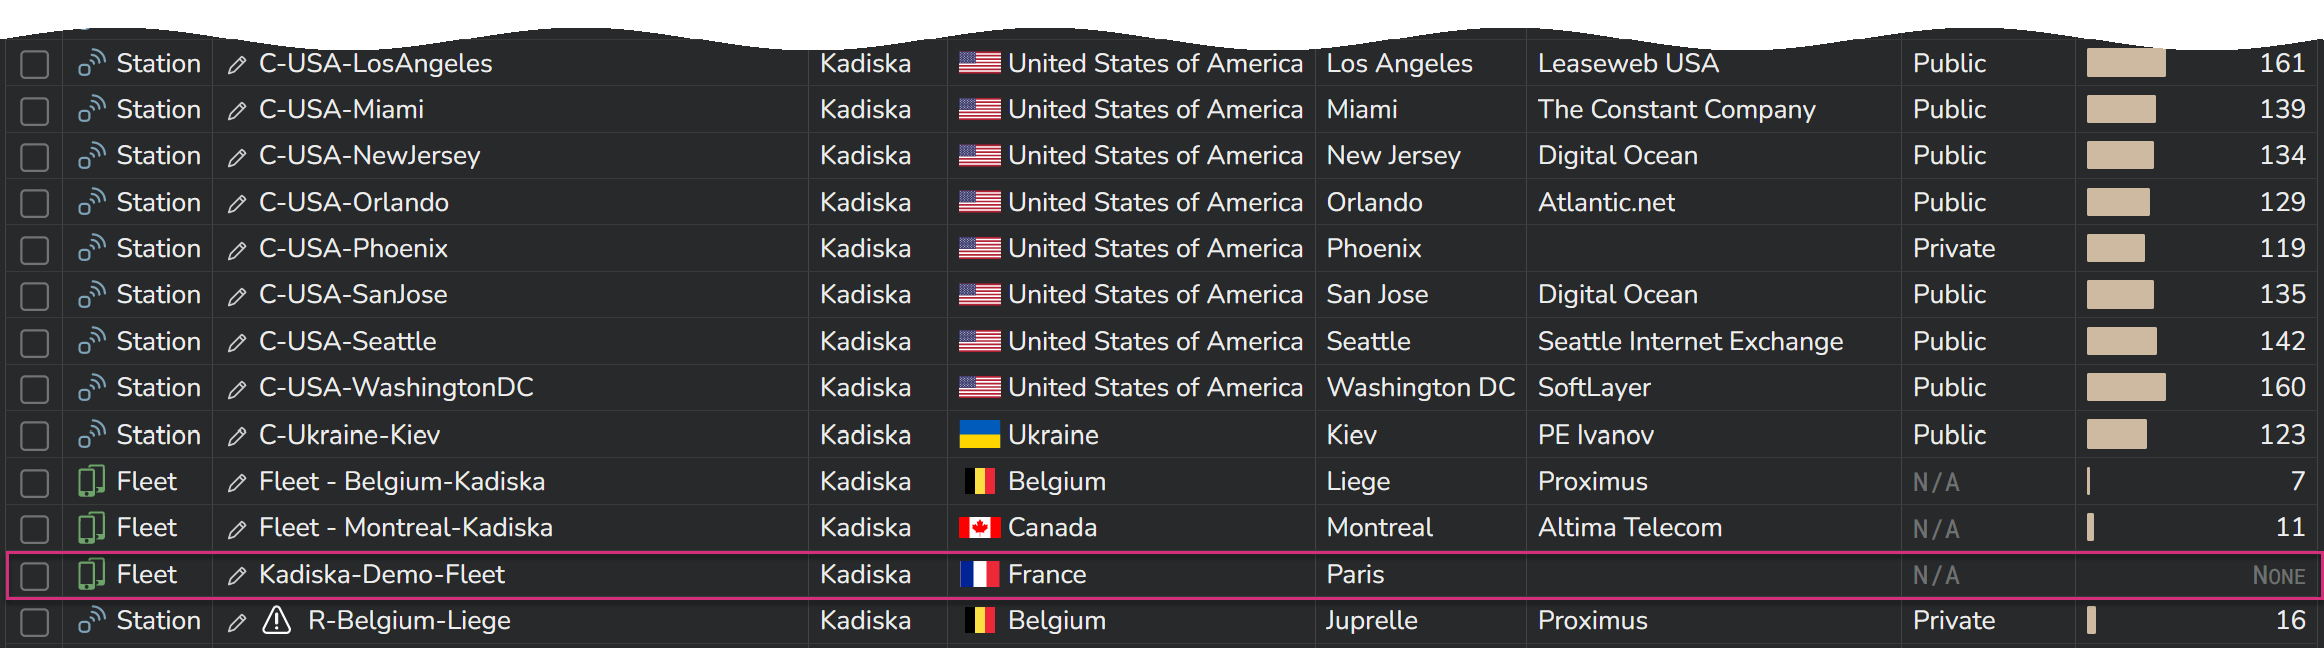
If you go to the list of available Testers (button "Testers"), you can see the newly created Fleet.
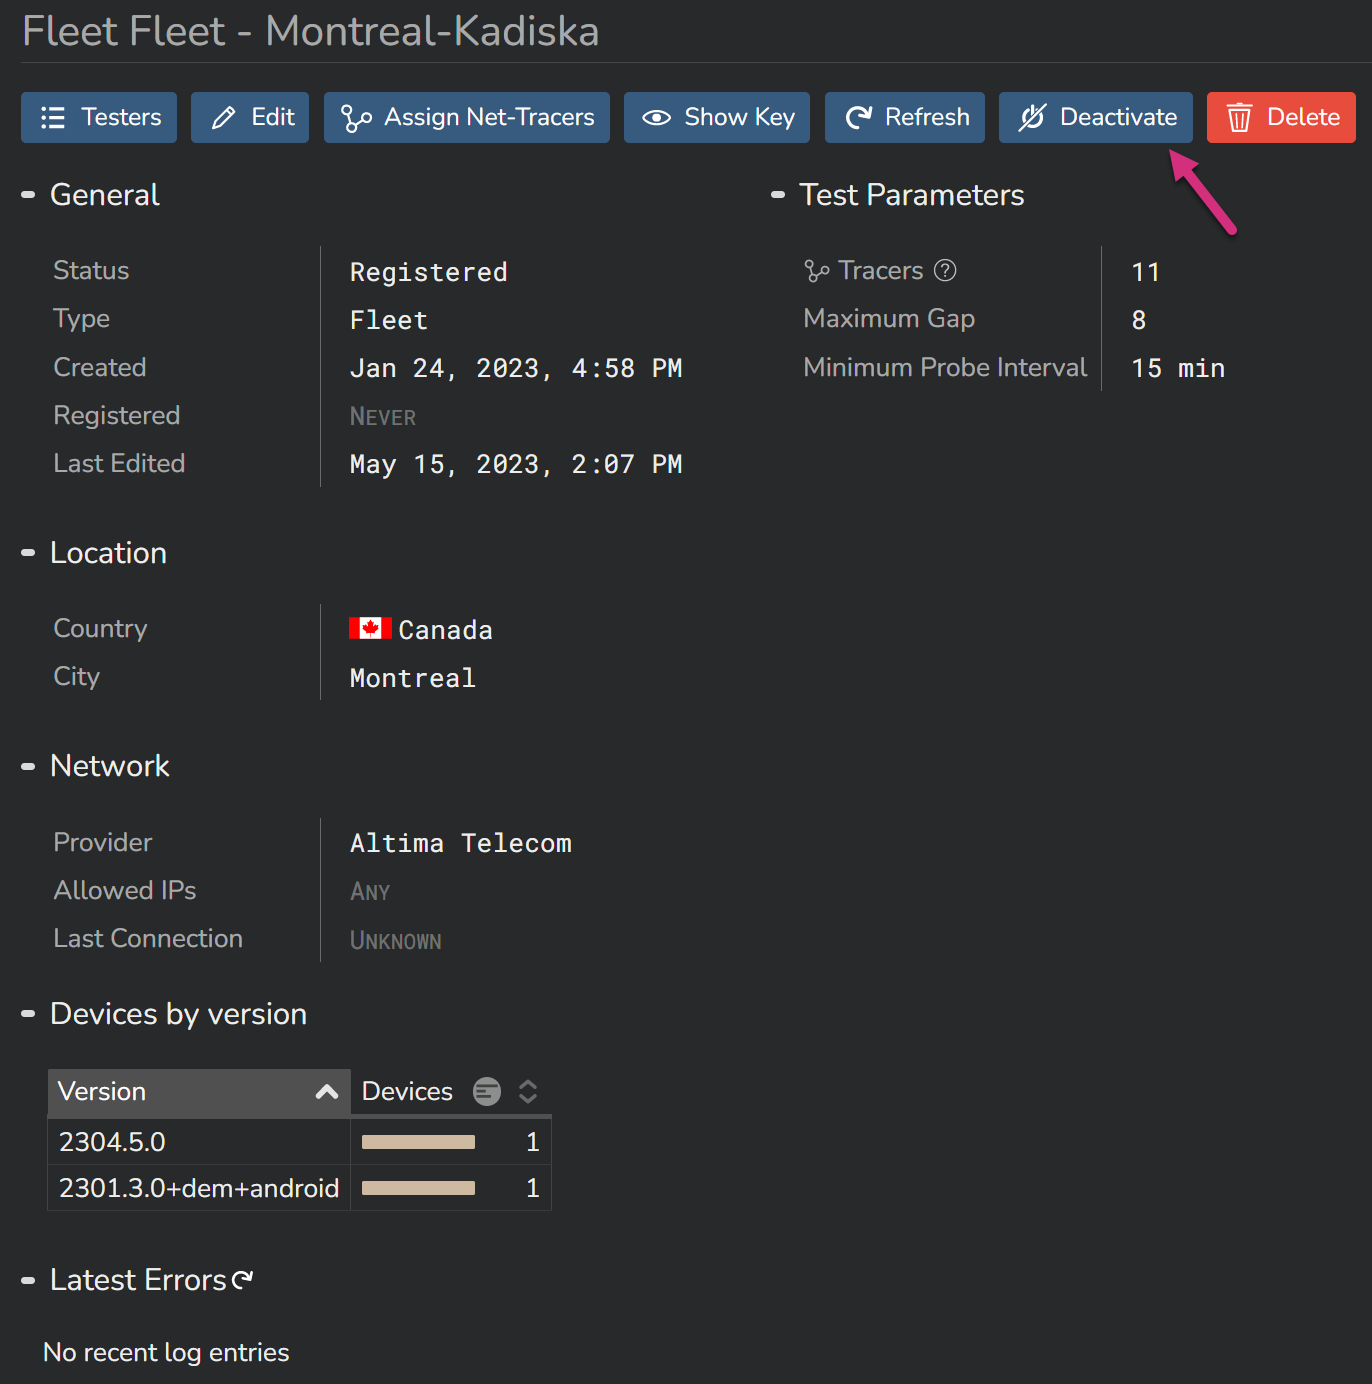
Disabling a Fleet
If you want to temporarily deactivate a Fleet without deleting it, you can do it by clicking on the "Deactivate" button in the Fleet's configuration menu.
The Fleet can be reactivated at any time. The corresponding Tracers will be automatically reassigned and launched.
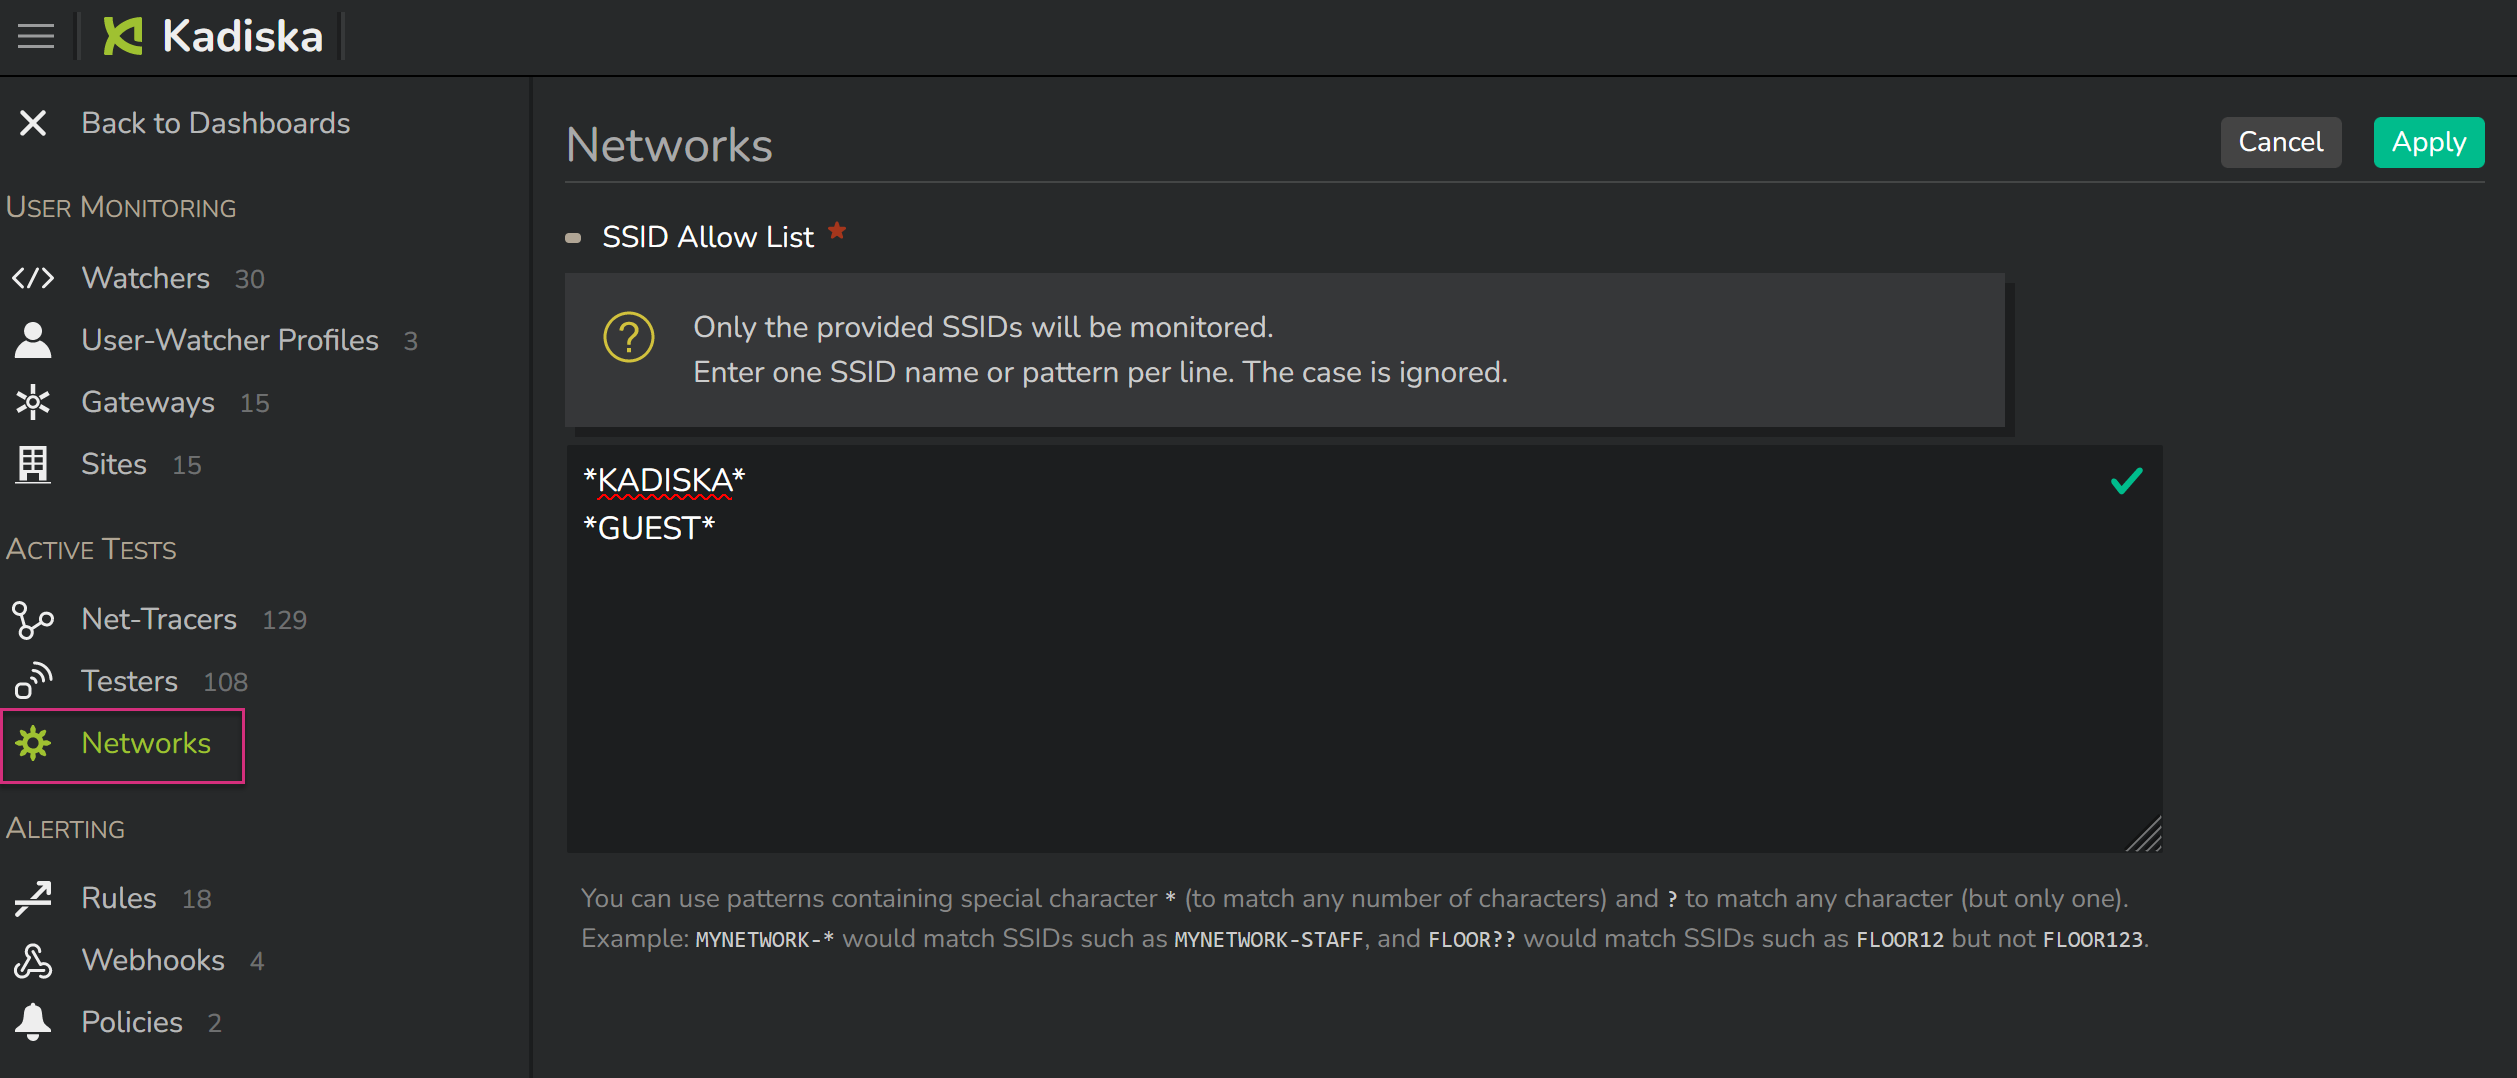
White listing Wi-Fi networks
By default, Net-Tracer tests are automatically triggered from all devices that are part of a Fleet for which Net-Tracer targets have been configured.
However, in some cases, you may not want to analyze connectivity performance. For example, you may not be interested in collecting performance data when users are connected to their Wi-Fi home network.
You can whitelist certain Wi-Fi networks by providing a list of SSIDs. In this case, performance data will only be collected and processed when the device is connected to one of these allowed networks. You can use patterns to specify multiple SSIDs at once.
Note that this whitelist only applies to Wi-Fi networks. When devices are connected to 4G/5G networks, performance is systematically monitored.
To configure the whitelist, navigate to the main configuration menu and select "Networks".