Connection time
The "Connection" metric corresponds to the time needed to set up a TCP connection to the HTTP-Tracer target. In the Kadiska platform, this is sometimes referred as "Network latency".
This metric is available in different dashboards.
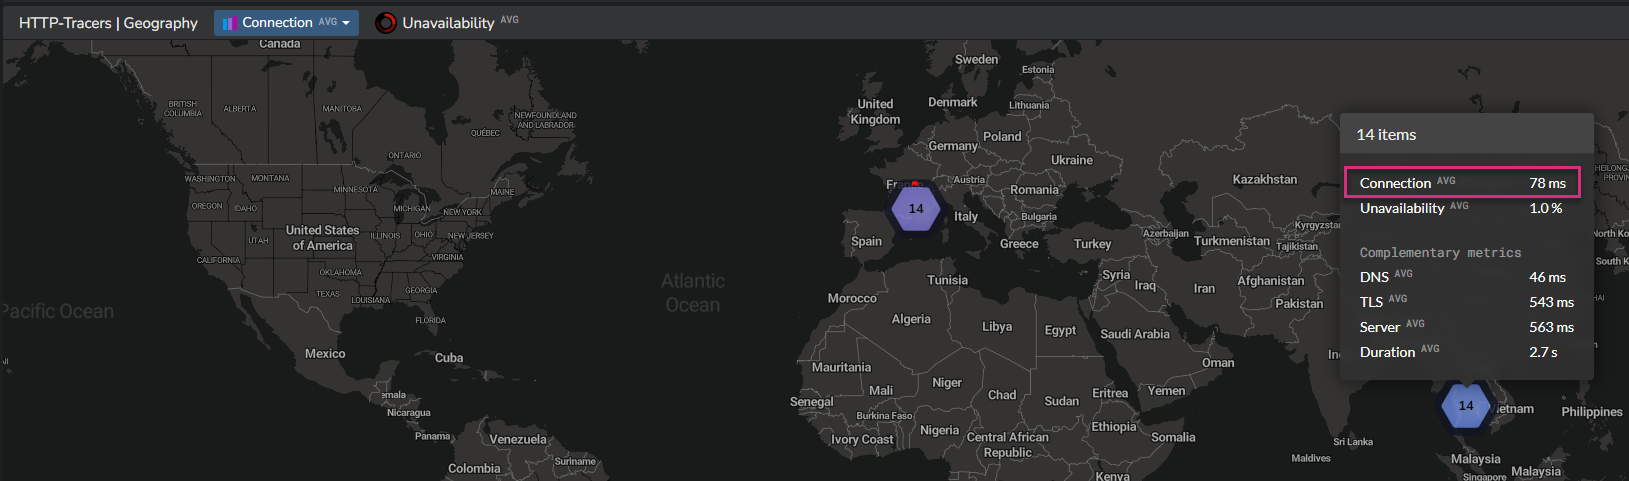
First, it is provided on maps.
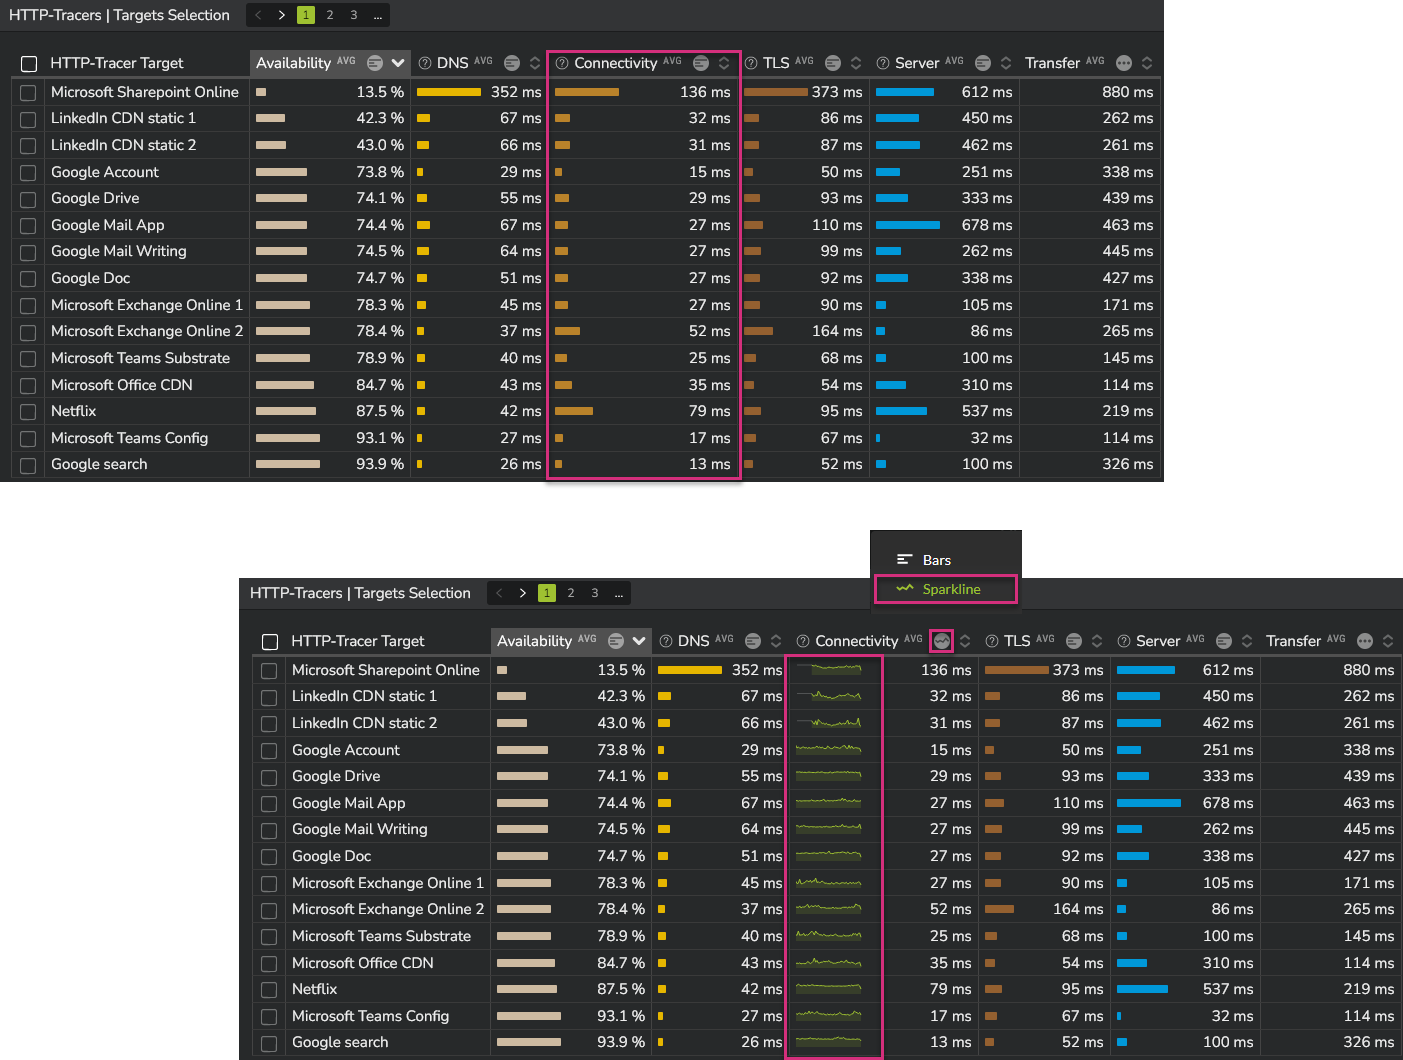
It is also provided in different tables in the dashboards "Network Overview", "Performance by Tester" and "Performance by Target". Activating the "sparkline" option allows you to see the evolution over time, right from the table:
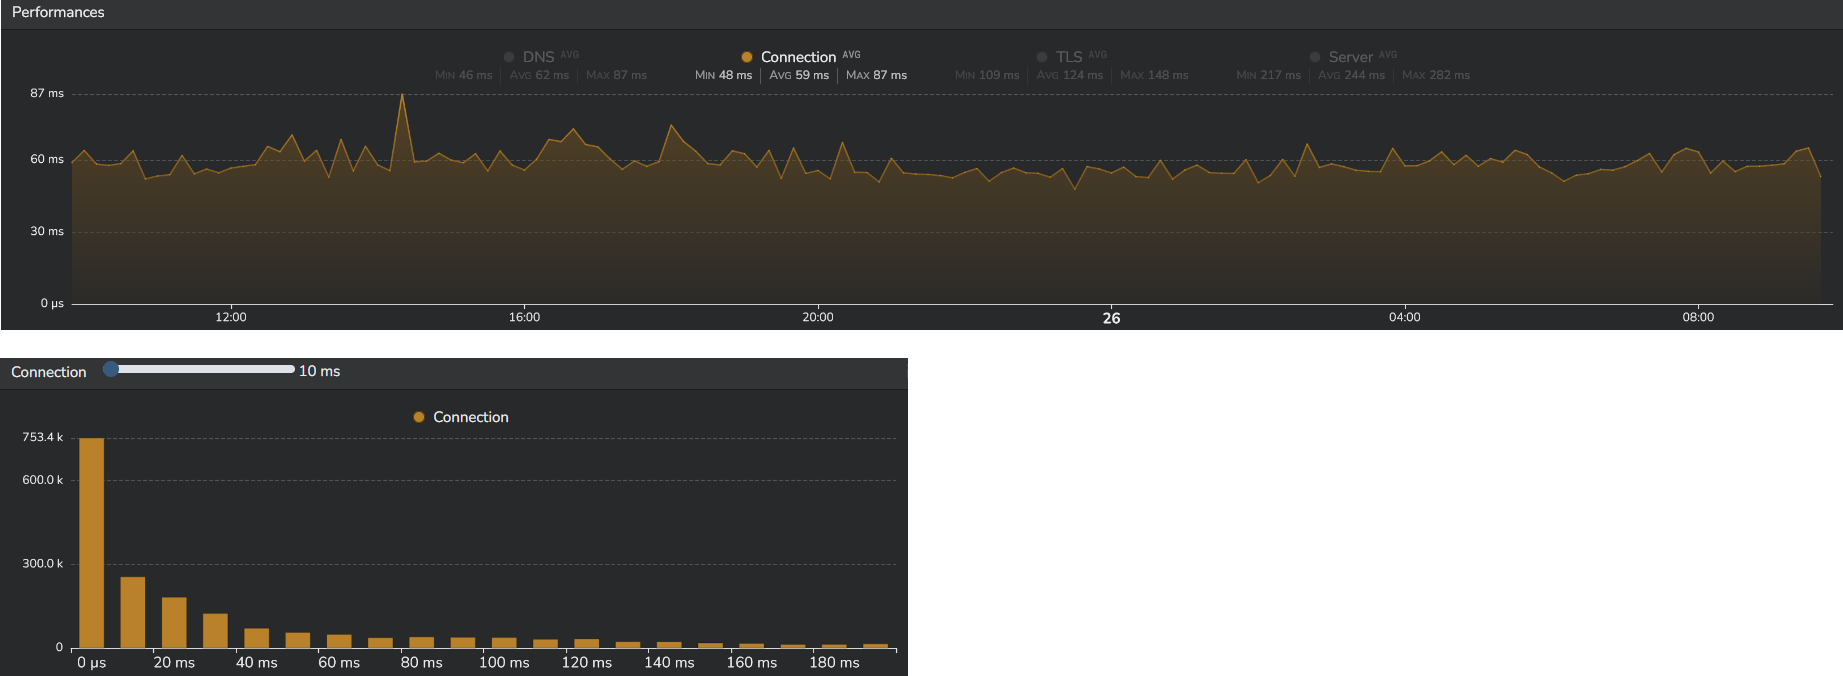
Finally, the "Web performance" dashboard provides the evolution over time of this metric, as well as the distribution graph.
Important note:
When redirections occur, the connection time value corresponds to the sum of all connection times measured for each redirection, up to the final destination.