Server
Definition
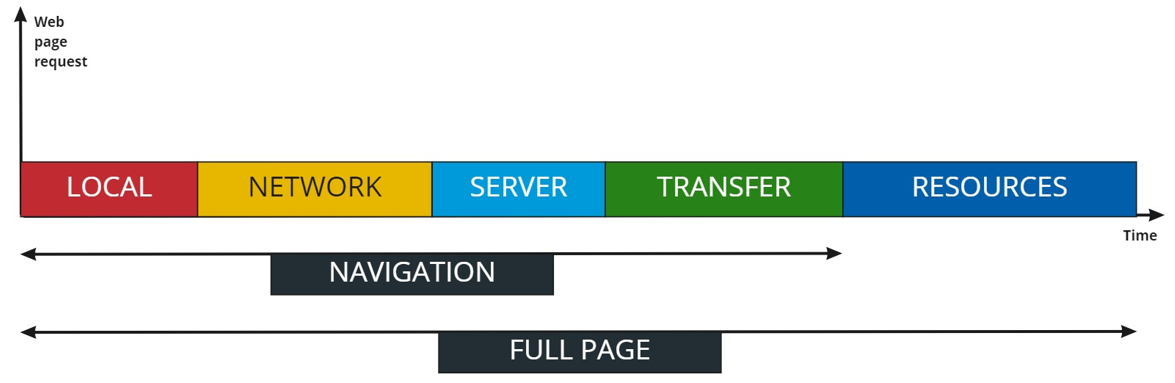
The process of loading a web page can be split into the following main steps:
- The browser processes the request locally, checking for local cached data for example, before performing any network request
- If the resource is not available locally, it is requested on the network
- The server receives the request and processes it
- The requested data are transferred from the server to the browser through the network
- The web page is being rendered on the user's browser
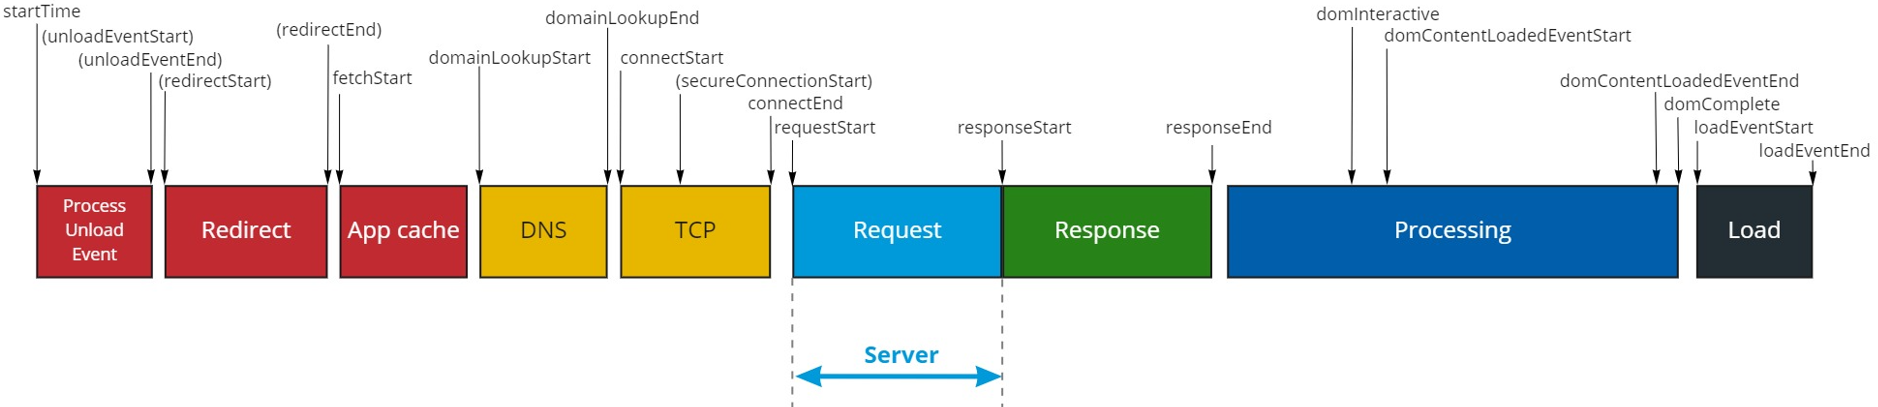
As shown on the W3C Time Navigation API view hereunder, Server time = responseStart - requestStart.
It is equivalent to what is commonly called TTFB (Time To First Byte).
Once the client has sent a web request to the server, the Server metric corresponds to the time it takes for the server to send the first packet (which includes the response status code) back to the client.
This is a very important performance metric as it directly relates to the server performance!
The Server value is provided at navigation level as well as at resources level.
Navigation level
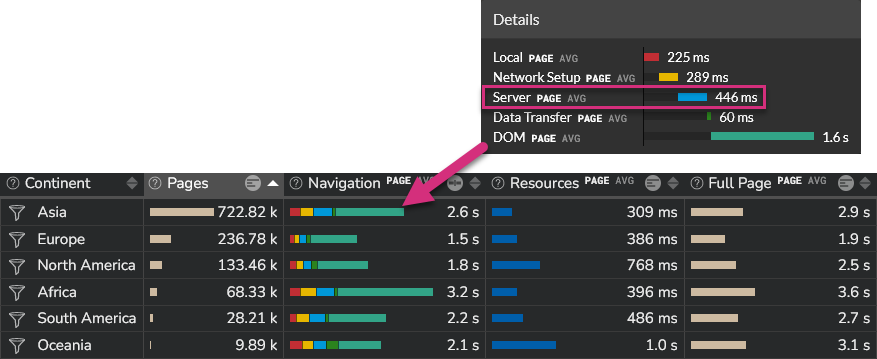
When you look at web page global performances in the "Scope Analysis" section, you see two main performance metrics :
- Navigation: time it takes to construct the web page structure
- Resources: time it takes to fetch all resources that compose the page
Mouseover on any Navigation breakdown bar to see more details, and more specifically here the value of the Server metric.
Resource level
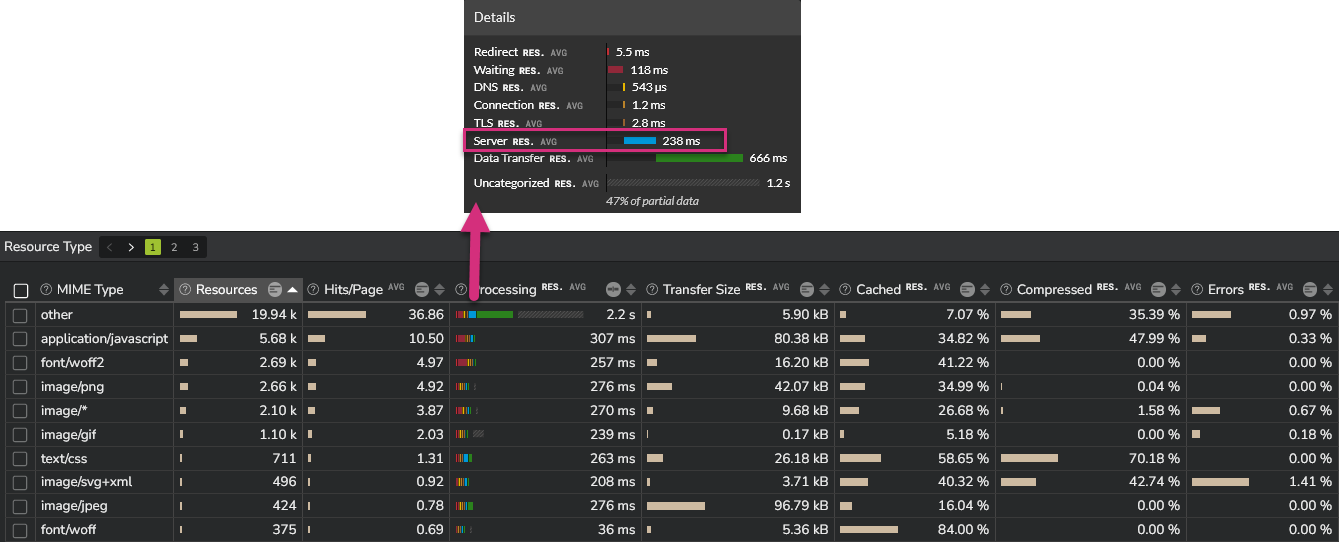
When moving to a "Resources Analysis" section, you can get these Server time values for resources. They can be grouped by resource types (see screenshot below), hosts, URLs, and initiator types.
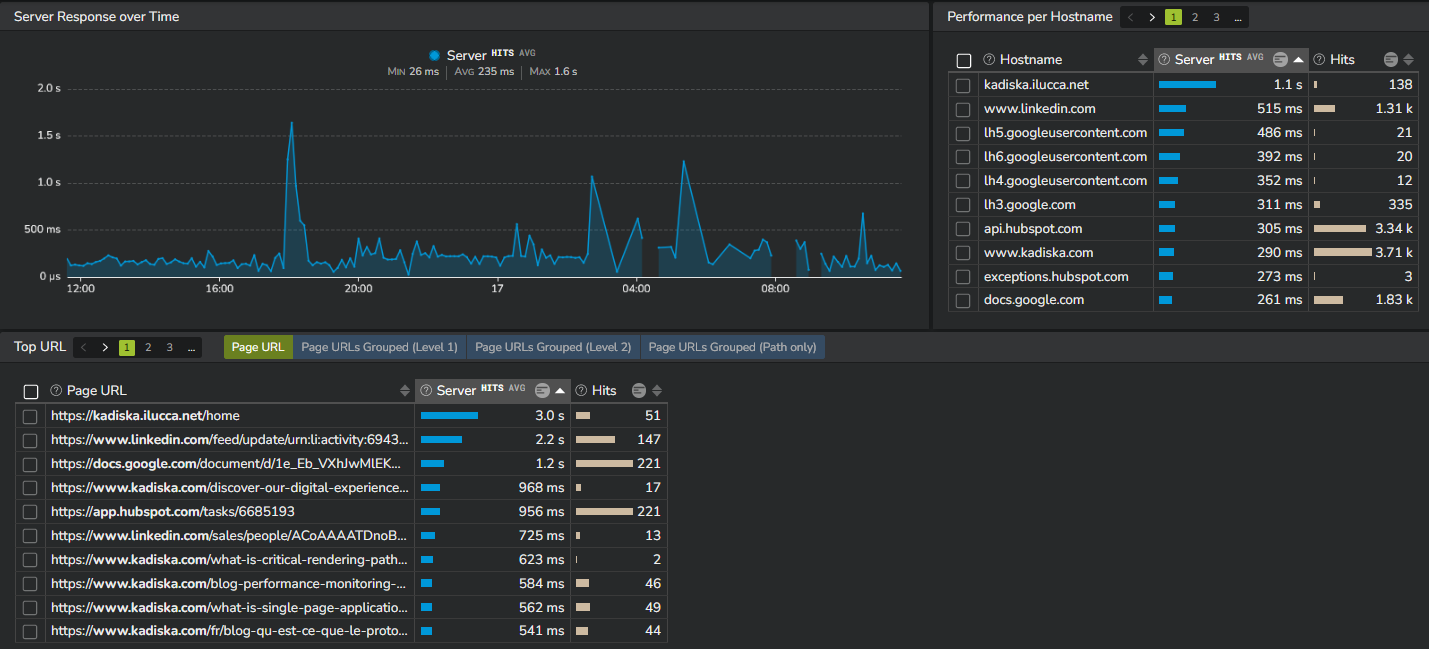
The Server dashboard
When you want to only focus on the Server time for specific applications, hosts, or any other type of context (you can filter on anything to answer your questions, like the HTTP protocol, the browser type used, resources type, ISPs, users locations, ...), use the "Server" section. It provides the Server performance evolution over time, as well as this performance metric per host and per navigation URL: