Configuration
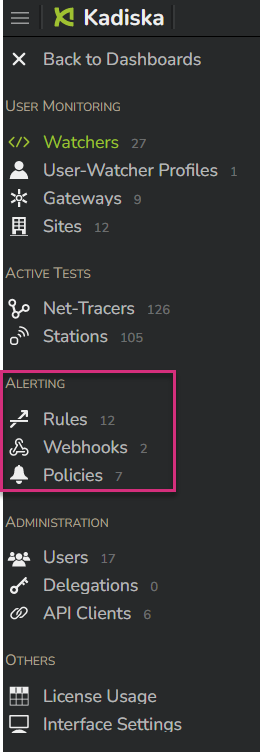
The alerting configuration section is available in the main Kadiska platform configuration menu:
Step 1: Rule
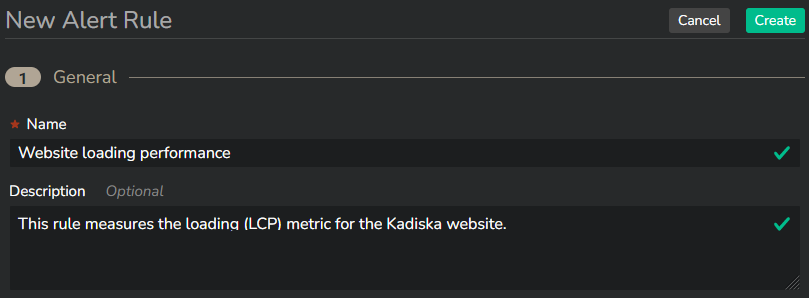
The first step in creating an alert consists of determining the condition(s) in which an alert must be triggered.
There are four sections in the rule creation menu.
First, you give the rule a name and an optional description:
Next, you select the metric the alert will be based on.
You can freely choose between Watcher and Tracer related metrics. Select the proper category in the "Source" section:
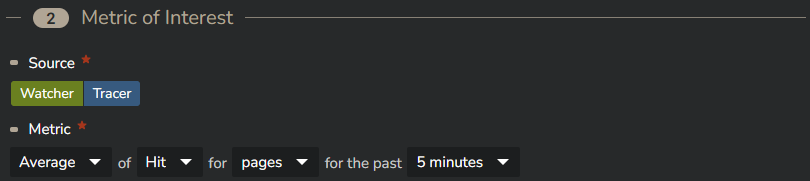
Independently of the chosen metric, the calculation can be based on:
- 50th percentile (Median)
- 75th percentile
- 90th percentile
- 99th percentile
- Average
- Maximum (At least one measure exceeds the threshold)
- Minimum (All measures exceed the threshold)
The last two calculations are respectively valid for measures that exceed an upper limit as well as for measures that go below a lower limit.
Some Watcher-based metrics will offer two options: "Overall" and "Spent".
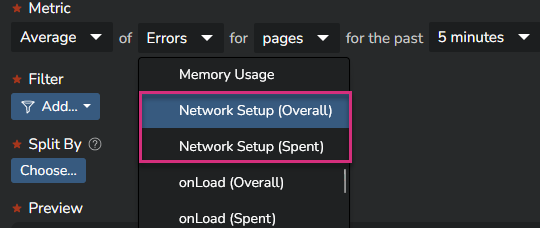
In a "Spent" metric, all values equal to "0" are taken into account in the average/percentile calculation.
In an "Overall" metric, these "0" values are excluded from the calculation.
Please refer to this release note for more details about the reasons why you would consider one metric vs another.
Metrics based on the Kadiska Watcher can be calculated at different levels: pages, hits, resources and requests.
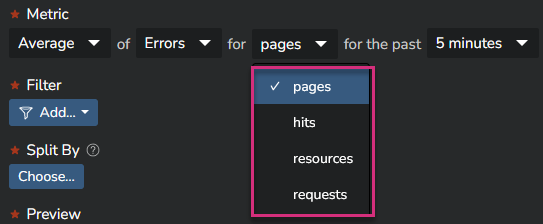
Please refer to this section for more details about these different resources types.
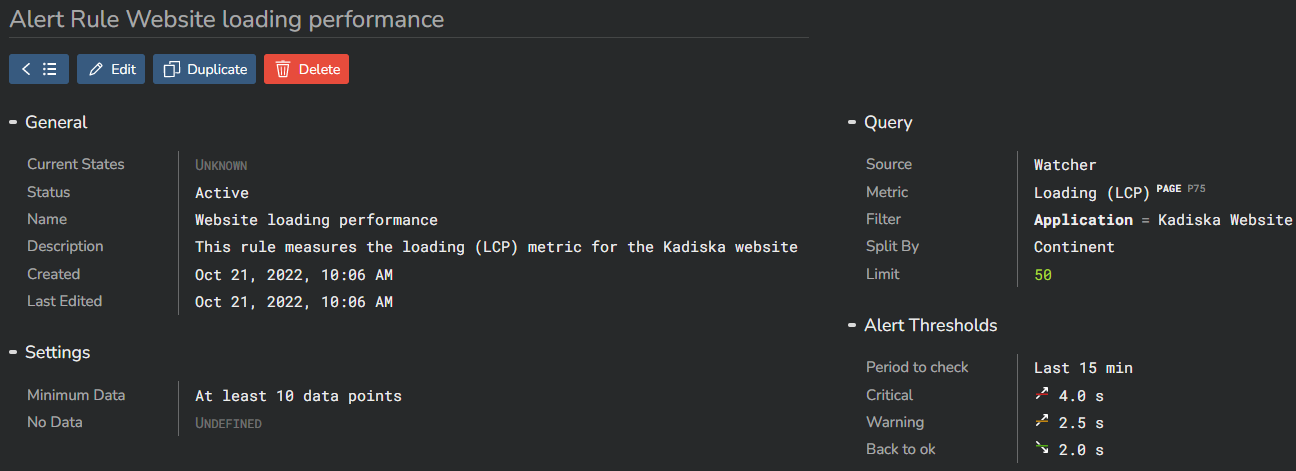
Once you have selected the metric, you must specify the time frame you consider to calculate the consecutive values of the monitored metric.
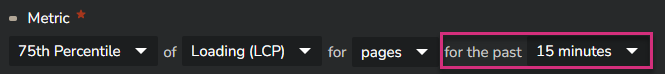
In the example above, the LCP value in P75 will be calculated every 15 minutes.
A potential alert will be triggered based on this 15 minutes P75 calculation.
The default value is 5 minutes.
So far, you have not specified any application or other focus criteria.
You can do this by using the "Filter" option.
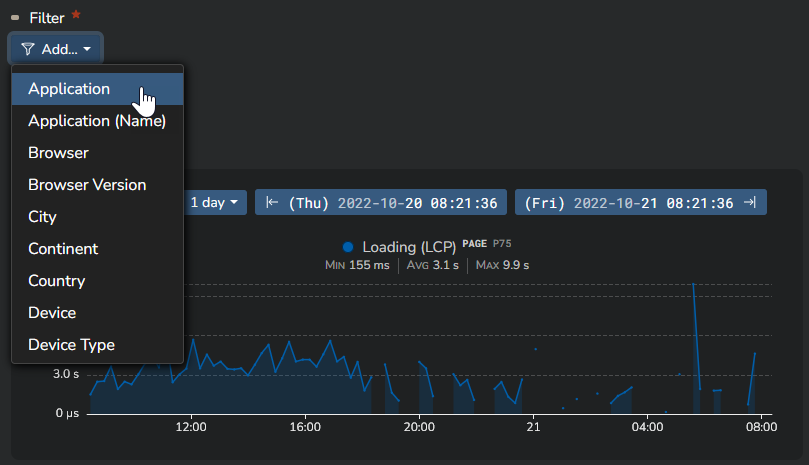
You can filter on any element available in the Kadiska platform.
In this example, we filter on the Kadiska website.
You can see how the "Preview" timeseries shows the chosen metric evolution over the past 7 days. This will help you define the alerting thresholds.
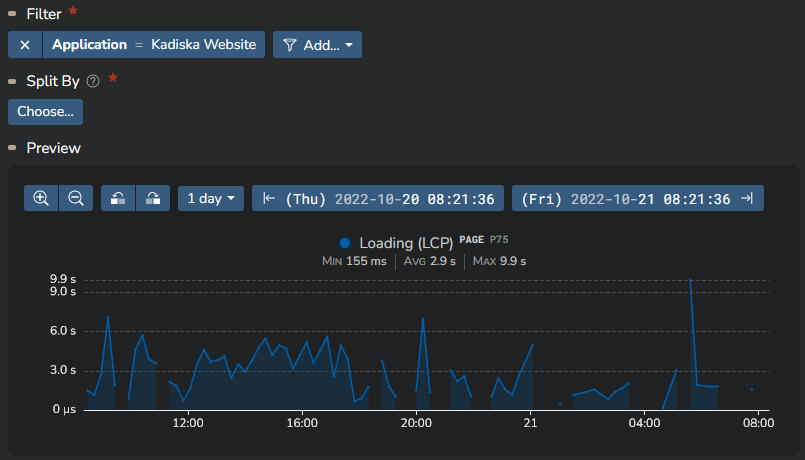
In this example, we define an alert for our Website, based on the P75 value of the LCP metric.
If you need this alert to be specifically applied to each continent for example, you could think about creating one specific alert per continent by adding the appropriate additional filter.
Nevertheless, there is a better and easier way to achieve this by using the "Split By" option.
When using the "Split By" option, each possible element within the split will be monitored separately from all others, triggering a specific alert in case one of the defined thresholds (next step) is reached.
In our example, if we configure a "Split By Continent", the LCP value will be monitored for each individual continent, and specific alerts may be triggered accordingly.
Depending on the element chosen for this "Split By", you can end up monitoring a lot of different individual items. These individual items are called Monitored Groups.
The number of monitored groups you can be alerted on is based on your subscription plan.
As you can see on the following screenshot, we show you the number of monitored groups for the last 7 days that corresponds to your specific alert configuration.
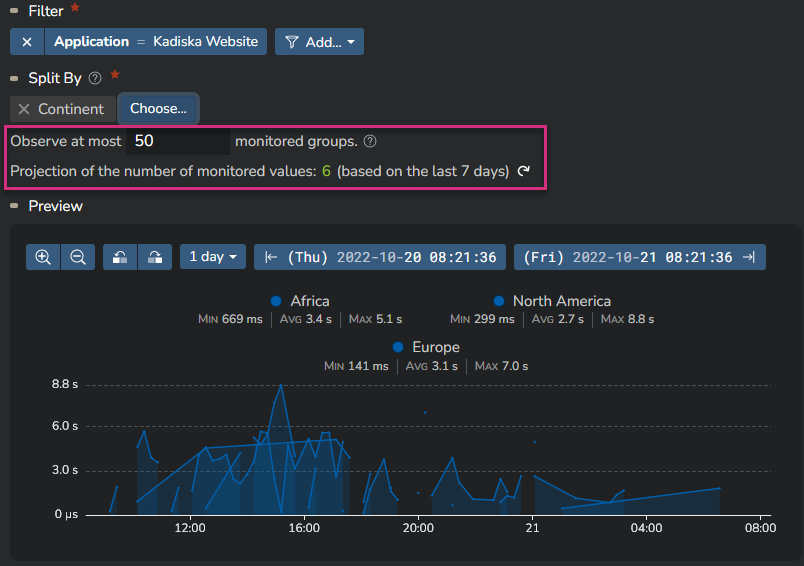
You can configure the maximum number of monitored groups you allow Kadiska to observe for this alerting rule. By default, this number is 50.
Note that the preview timeseries is now updated with the top 3 monitored groups.
If the number of monitored groups exceeds the allowed value you configure, Kadiska will take the top X (X corresponding to your configured maximum value) per time frame. This top can be different from one time frame to the next one!
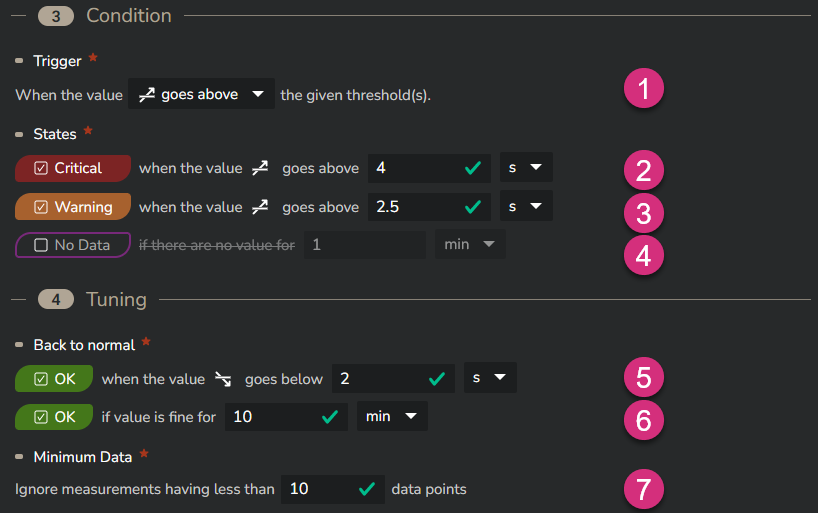
The last step in creating a rule consists of setting up the thresholds.
You can trigger an alert if the monitored value exceed a certain value from above or from below (1). Generally you'll trigger an alert when the monitored value goes above the threshold. This will be the case for performance metrics. But when you monitor other metrics like the transmitted payload, you might also be interested in being alerted when the value goes below a certain threshold.
You can define three types of alert states: "No Data" (4), "Warning" (3) and "Critical" (2).
You have to set up a threshold for at least one of them.
Optionally, you can define values that will trigger a return to a normal state. This back to normal state can be triggered by an additional threshold (5) as well as a corresponding time frame (6). In the example below, the back to normal state is triggered when the LCP value remains below 2 seconds for at least 10 minutes.
Finally, you can specify the minimum number of measurements that are needed to trigger an alert.
In the example below, a P75 LCP value that would exceed 2.5s or 4s would only trigger a "Warning" or a "Critical" alert if the number of individual measurements from which this P75 values has been calculated is at least 10. If this value has been calculated with less measurements, than no alert is triggered.
This allows you to better take the scope of degradation into consideration.
When your thresholds configuration is done, you'll see them in the preview timeseries.
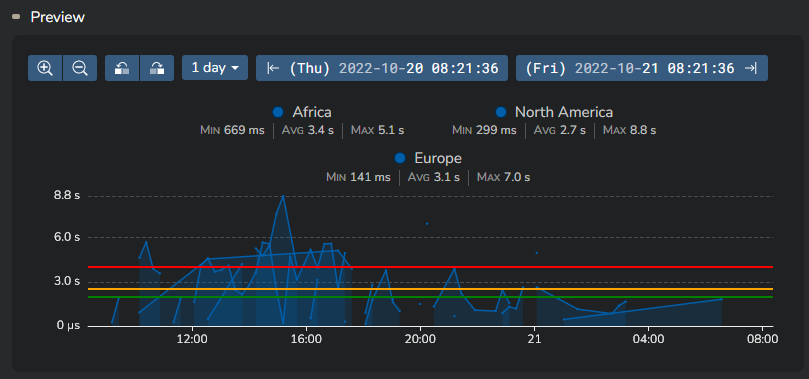
Click on the "Create" button at the top right of this configuration menu to confirm your settings. The rule is now created.
Step 2: Webhook
A webhook defines the communication channel to use and specifies the content of the message to be sent in case of an alert. For more information, please refer to main concepts section.
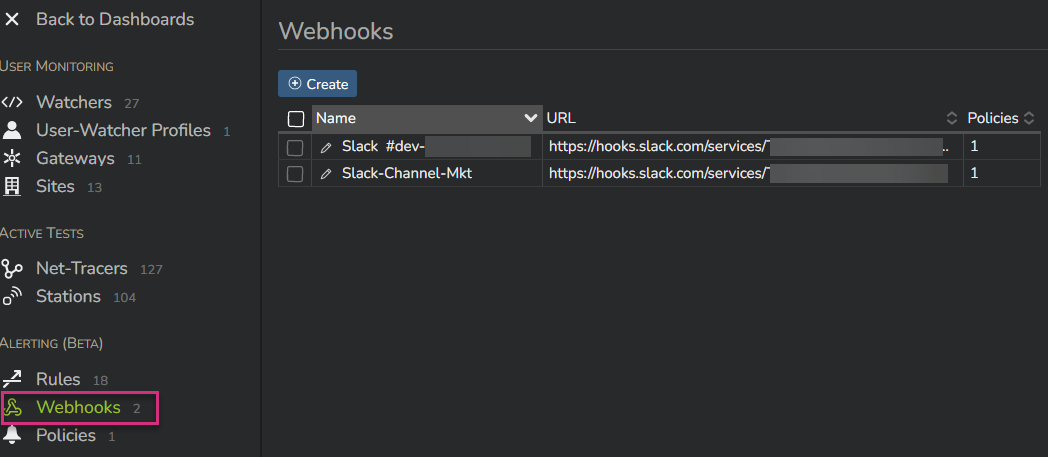
To create a new webhook, go to the "Webhooks" menu of the Alerting main section:
Setting up a webhook requires a name (1), a URL (3) and a payload (4). In option you can also provide a description (2) as well as specify custom headers (5).
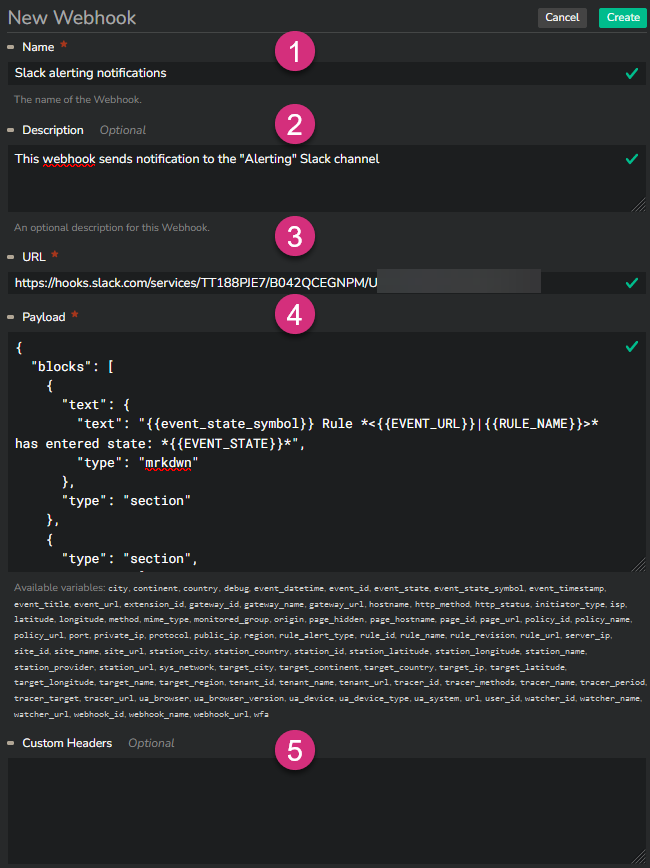
The URL specifies the destination of the webhook.
For example a Slack webhook will have the following format:
The payload, provided in a JSON format, specifies the message to be sent.
The available variables are provided below the payload field.
You can add custom headers to the webhook in specific situations, like when the webhook must be authenticated.
When the configuration is done, click on "Create" at the top right of the configuration page.
The webhook configuration is done.
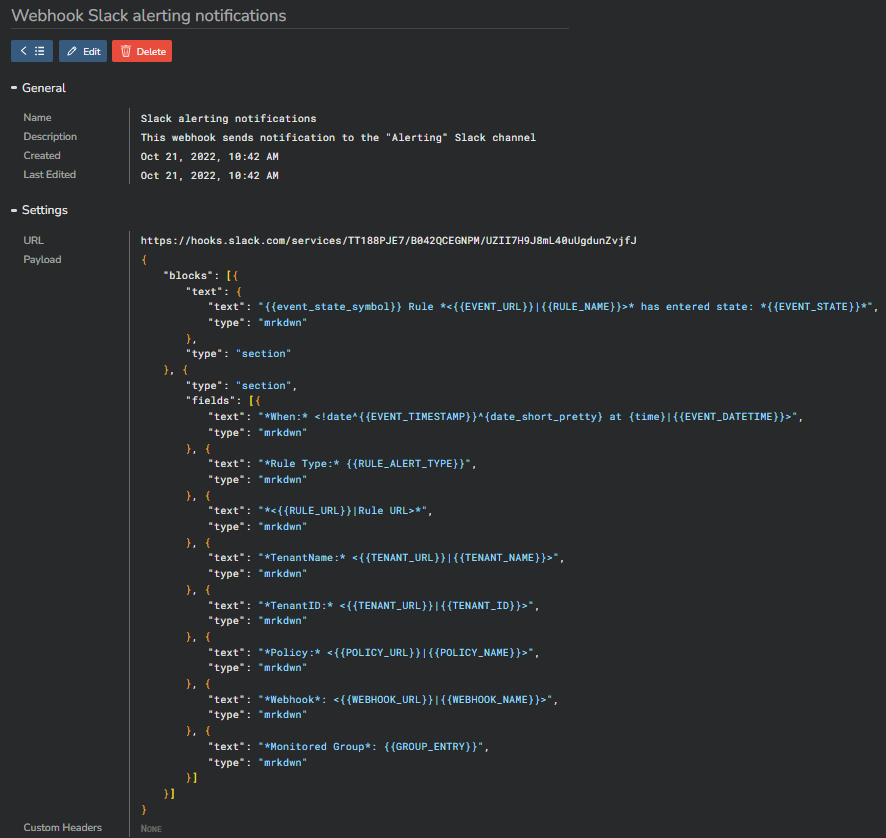
This is an example of a webhook sending messages to a Slack channel:
URL:
Payload:
{
  "blocks": [
    {
      "text": {
        "text": "{{event_state_symbol}} Rule *<{{EVENT_URL}}|{{RULE_NAME}}>* has entered state: *{{EVENT_STATE}}*",
        "type": "mrkdwn"
      },
      "type": "section"
    },
    {
      "type": "section",
      "fields": [
        {
          "text": "*When:* <!date^{{EVENT_TIMESTAMP}}^{date_short_pretty} at {time}|{{EVENT_DATETIME}}>",
          "type": "mrkdwn"
        },
        {
          "text": "*Rule Type:* {{RULE_ALERT_TYPE}}",
          "type": "mrkdwn"
        },
        {
          "text": "*<{{RULE_URL}}|Rule URL>*",
          "type": "mrkdwn"
        },
        {
          "text": "*TenantName:* <{{TENANT_URL}}|{{TENANT_NAME}}>",
          "type": "mrkdwn"
        },
        {
          "text": "*TenantID:* <{{TENANT_URL}}|{{TENANT_ID}}>",
          "type": "mrkdwn"
        },
        {
          "text": "*Policy:* <{{POLICY_URL}}|{{POLICY_NAME}}>",
          "type": "mrkdwn"
        },
        {
          "text": "*Webhook*: <{{WEBHOOK_URL}}|{{WEBHOOK_NAME}}>",
          "type": "mrkdwn"
        },
        {
          "text": "*Monitored Group*: {{GROUP_ENTRY}}",
          "type": "mrkdwn"
        }
      ]
    }
  ]
}
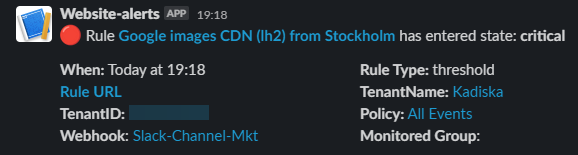
This is what a corresponding Slack message looks like:
Some references to configure webhooks to well-know tools:
Step 3: Policy
A policy is the link between a rule, the corresponding thresholds level (Warning/Critical/OK) and the notification channel. For more information, please refer to main concepts section.
Creating a policy is a three steps process:
- You create the policy itself and specify on which threshold level (Critical, Warning, No Data, OK) you want to be notified
- You link the policy to an existing rule (or multiple rules)
- You link the policy to an existing webhook (or multiple webhooks)
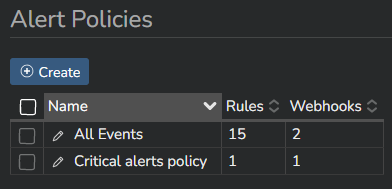
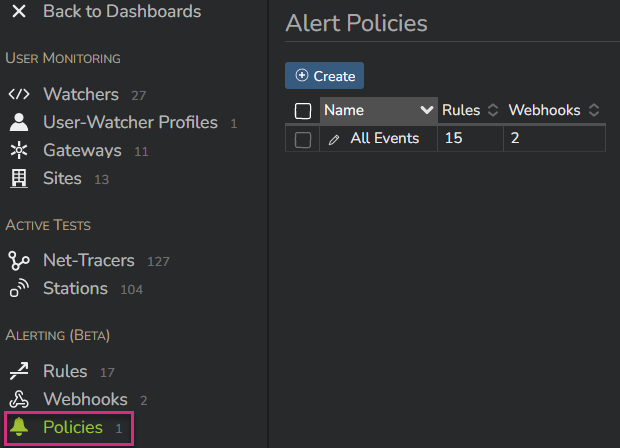
To create policy, go to the "Policies" menu of the Alerting main section and click on "Create":
Give your policy a name (1), a description (2) and choose the threshold level(s) that will trigger sending a notification through a webhook (3).
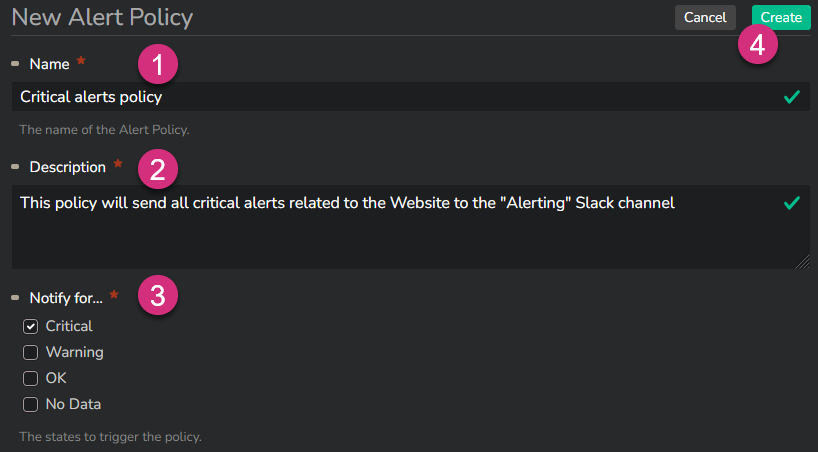
Then click "Create" (4) to confirm.
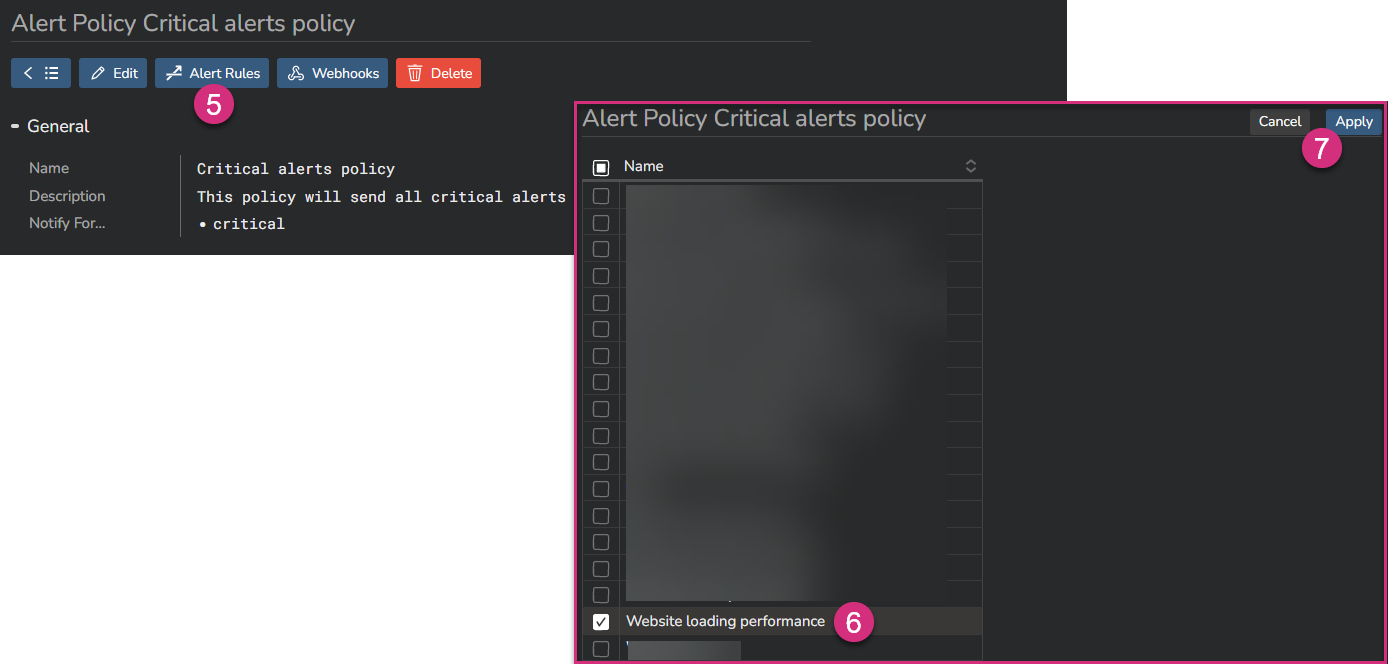
Click on the "Alert Rules" button at the top (5) to open the list of all configured alerts in your system. Select the rule(s) you want to link to this policy (6), and click on "Apply" (7):
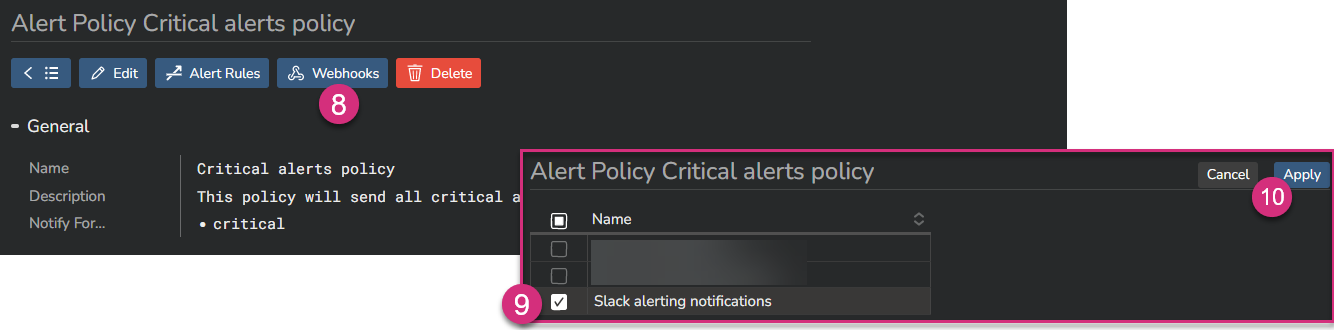
Then click on the "Webhooks" button at the top (8) to open the list of all configured webhooks in your system. Select the webhook(s) you want to link to this policy (9), and click on "Apply" (10):
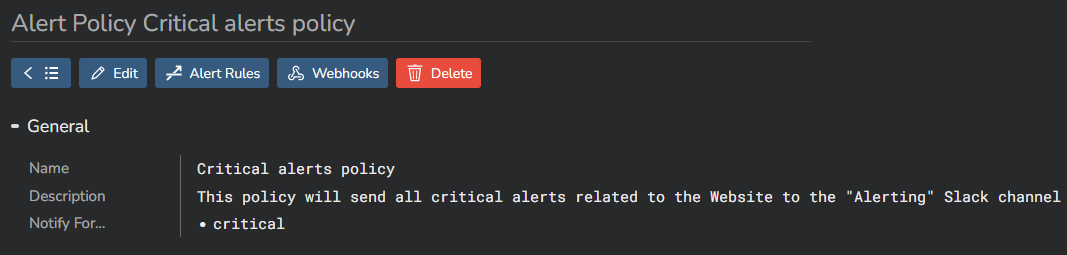
Congratulations, you are all done: