Release Note: November 2022
App-Watcher and User-Watcher universes have been merged
Historically, the App-Watcher universe was designed to troubleshoot application performance issues. Related dashboards typically allowed you to identify all third party services, like CDN providers, and assess their performance. From there, you could go as deep as you wanted in your analysis, up to a full waterfall view for each web transaction.
The User-Watcher universe at the other hand was more focused on understanding the users context in order to answer questions like "How do users connect to applications (from home, through VPN, SASEs, ...)?".
In practice, when analyzing issues, you often needed to navigate from one universe to the other.
Taking this into account, we have decided to merge both universes.
We made sure to keep all existing views and data you are used to have and also to optimize the end user experience.
New converged "Overview" dashboard
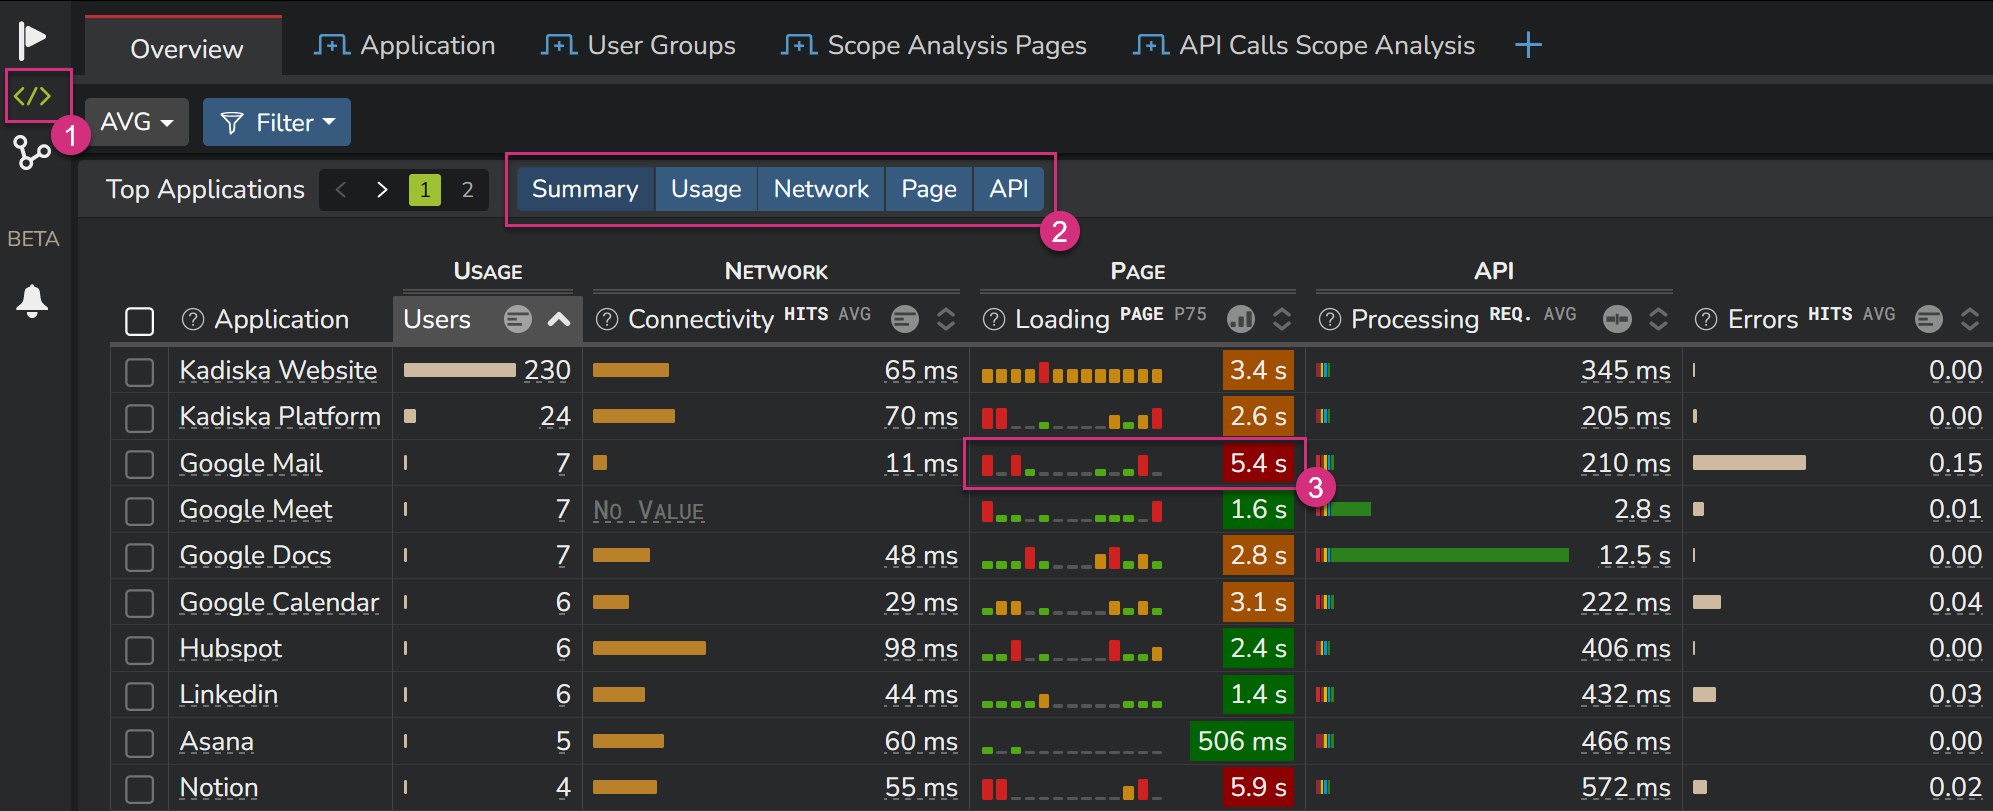
The new "Overview" dashboard is now accessible from the converged "Application" universe (1).
The first table provides the main usage and performance metrics overview:
- Usage: number of connected users
- Network performance: connectivity metric
- Traditional web application performance: Loading metric
- Modern web application performance (API calls driven): Processing metric
- Errors
You can now get more details about each theme by clicking on the corresponding button (2).
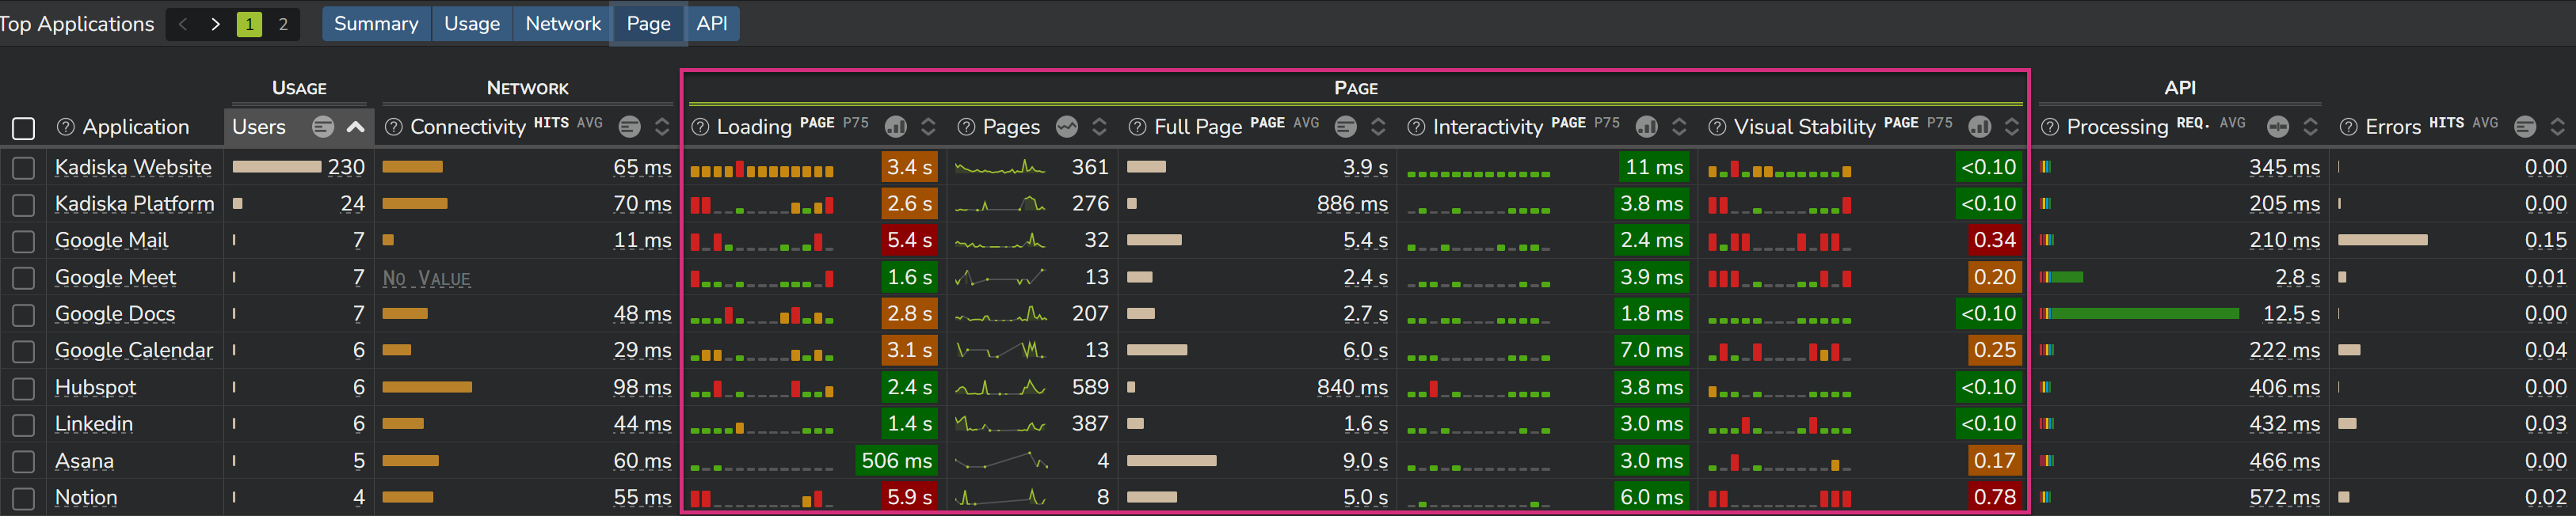
For example, when selecting the "Page" view, you get immediate access to the following additional metrics:
- Number of pages viewed
- Full Page
- Interactivity
- Visual Stability
Easier navigation to more contextual data
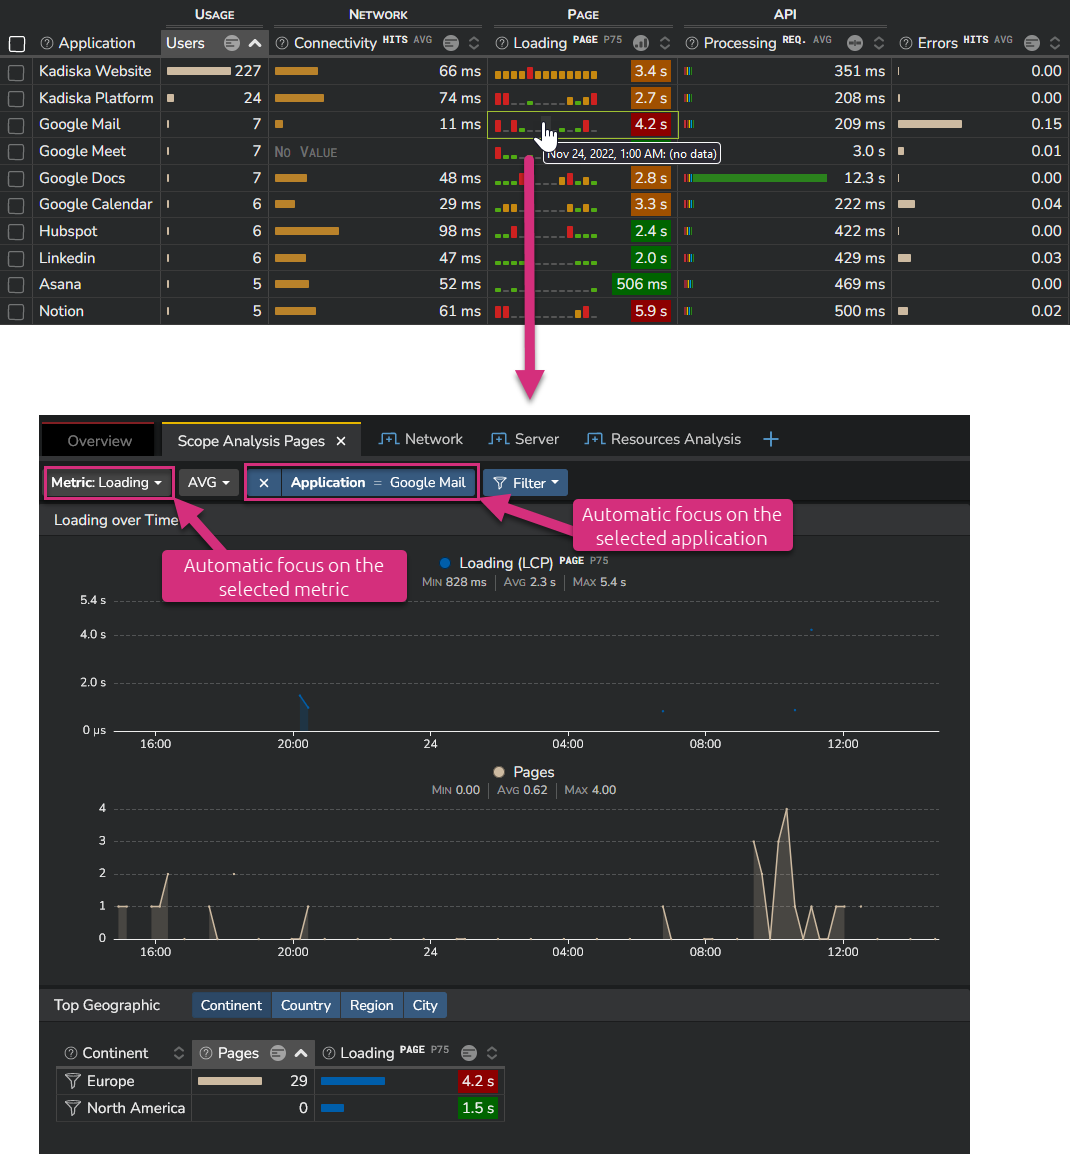
Clicking on any metric will directly redirect you to the appropriate dashboard and context.
In the example below, selecting the Loading value of the Google Mail application automatically redirects you to the Scope Analysis Page dashboard, with an automatic filter on Google Mail and a focus on the Loading metric.
New "Stations by Target" dashboard
So far, the Tracer related maps always showed the connectivity performance by Station:
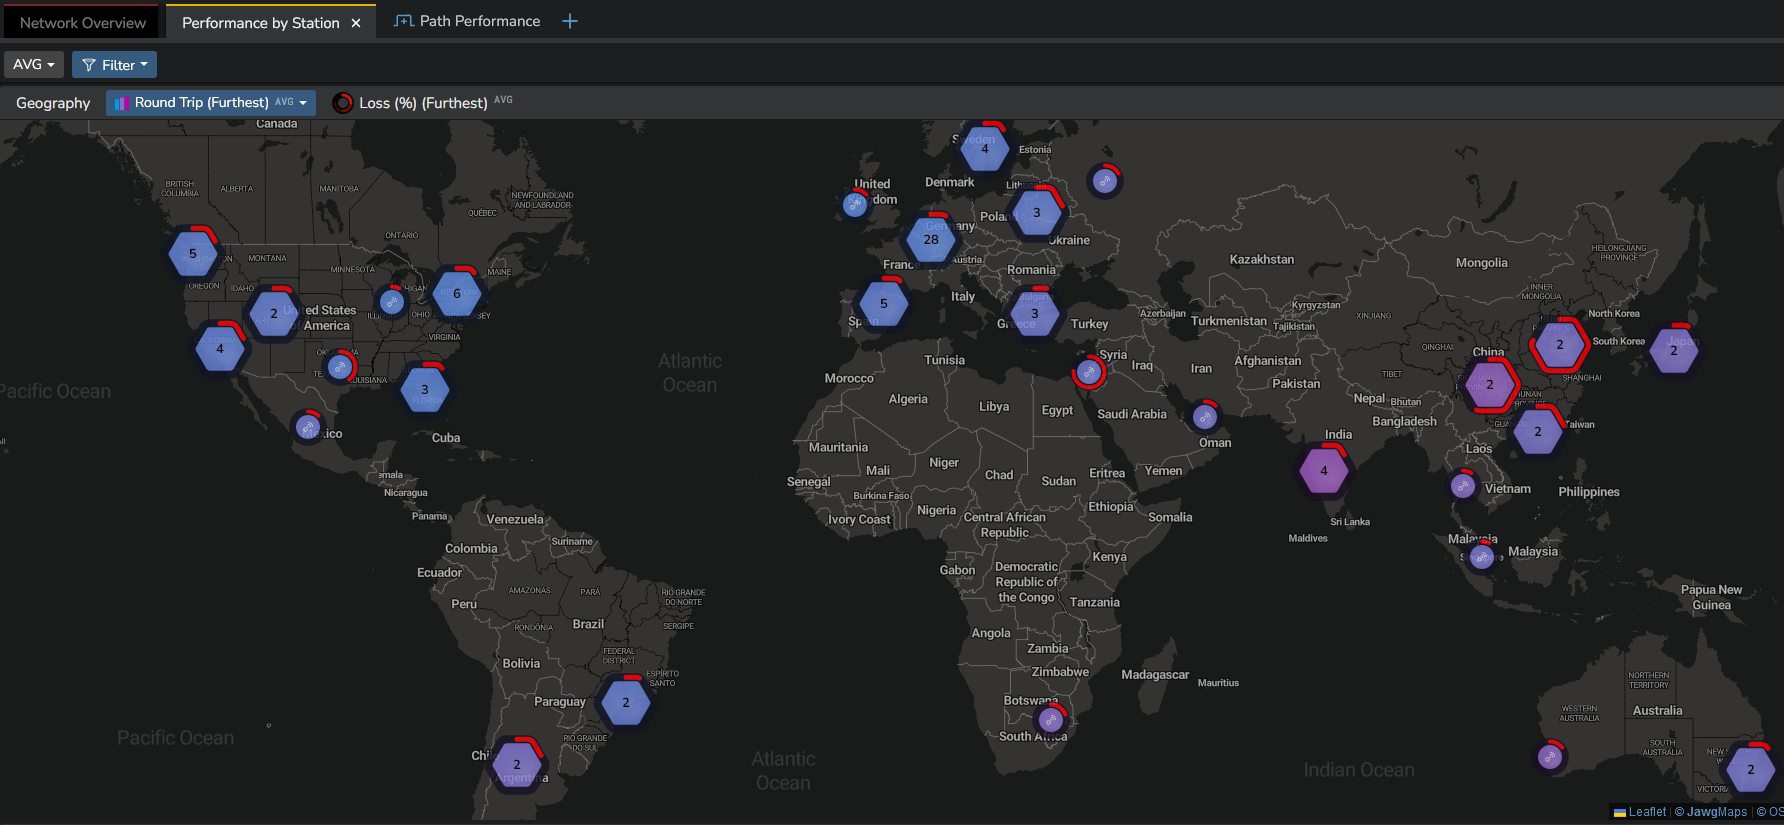
In the example above, the map shows the connectivity performance from all Stations, targeting all monitored applications.
Obviously, when you filter on one specific Station, this view does not make much sense anymore. You would end up showing one marker on the map.
Thanks to the new "Performance by Target" dashboard, you can now also adopt another viewing angle.
As its name implies, this dashboard provides a map representation of all monitored target. This is especially useful when filtering on specific Stations:
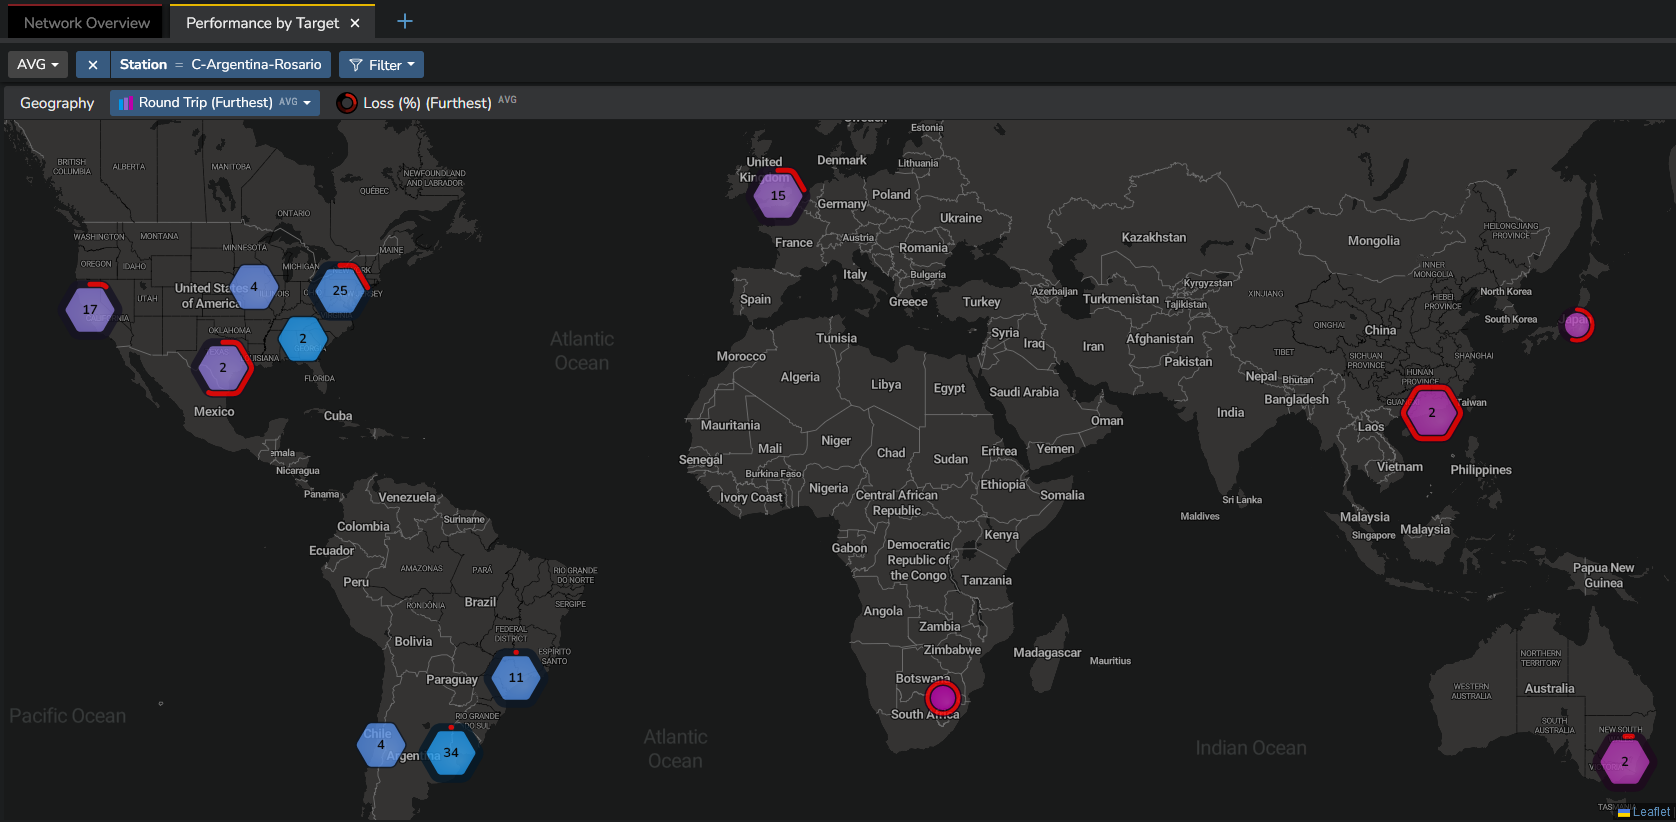
In the example above, the map shows the connectivity performance from the Station "C-Argentina-Rosario" to all monitored targets.
A typical use case for this view is when a company wants to monitor the connectivity performance from hundreds of corporate sites to the main corporate data centre.
Instead of deploying hundreds of Stations on corporate sites targeting the data centre, most of our customers deploy one centralized Station in the data centre, targeting all remote sites.
In this scenario, using this new dashboard allows them to clearly locate all remote sites on the map and easily detect any network connectivity performance issue.
Targets are located based on their respective IP address. Targets that correspond to private IP addresses are located at zero degrees latitude and zero degrees longitude.
Disabling Net-Tracers
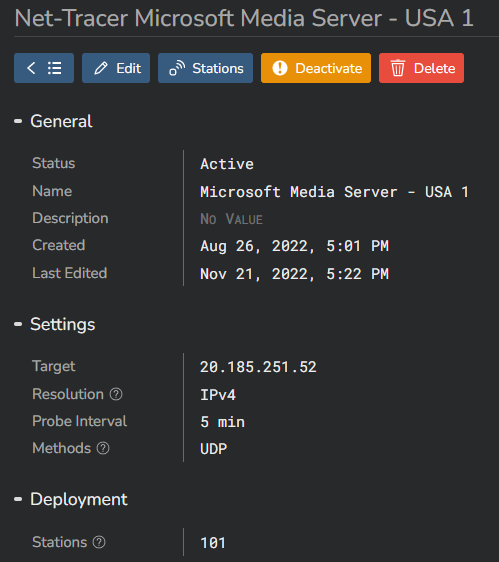
You can now temporarily deactivate any Net-Tracer without deleting its configuration.
Simply go the Net-Tracer configuration view and click on "Deactivate".
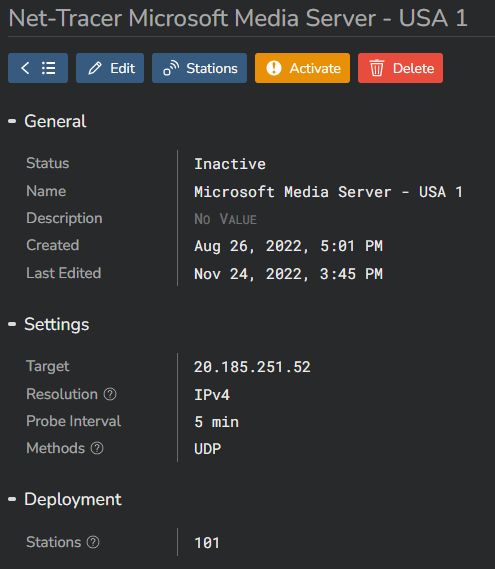
You can reactivate it at any time by clicking on "Activate" from the same Net-Tracer configuration view:
Disabling alert rules
The same way you deactivate a Net-Tracer, you can now temporarily deactivate any alerting rule from its configuration view.
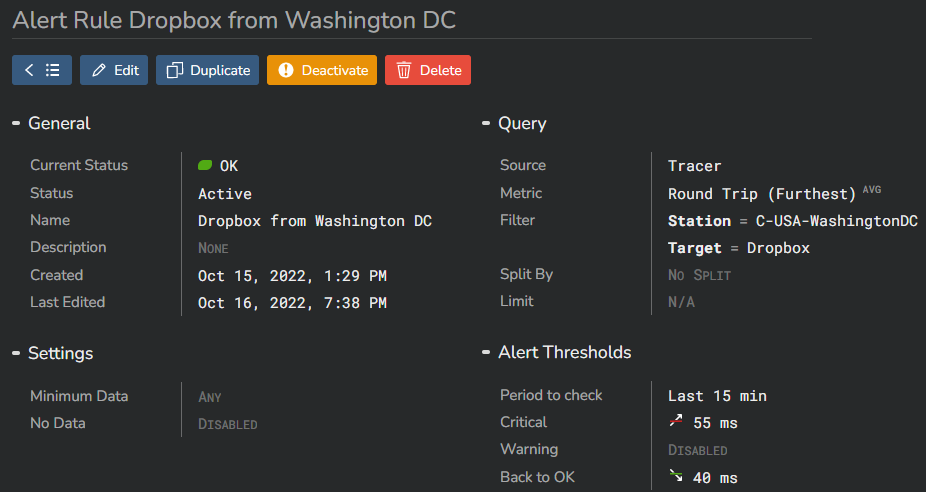
Again, simply click on "Activate" button to reactivate a rule.
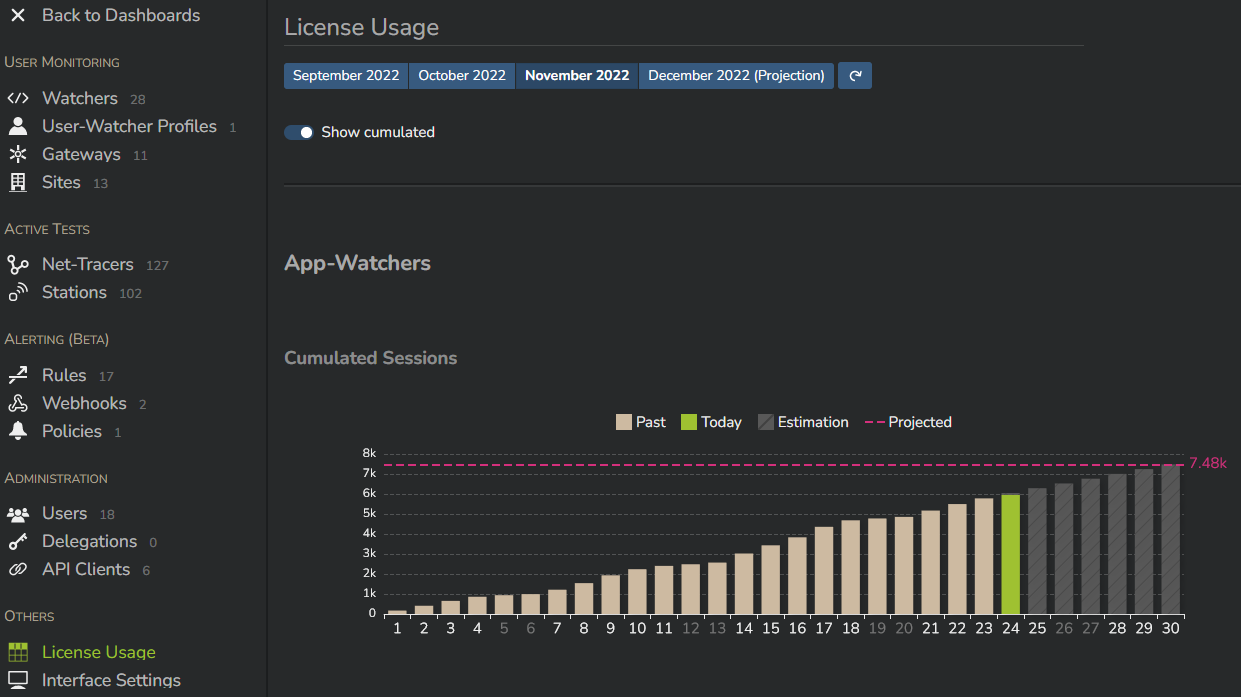
Watcher license usage monitoring
So far, the App-Watcher sessions reported in the "License Usage" dashboard also counted sessions triggered by User-Watcher users.
This is not the case anymore.
This view is now only valid for App-Watcher, User-Watcher being licensed by the number of monthly active users.
Refer to the Licensing section for more information.