RTT (Round Trip Delay)
In networking, RTT generally refers to the time needed for a packet to go from one end to another end, and back. Please refer to our article "What is network latency? How it works and how to reduce it" for more details.
In the Kadiska platform, the RTT value is provided at two different levels:
- RTT for end-to-end communications (between a Kadiska Tester and a Net-Tracer target)
- RTT for intermediate nodes (between a Kadiska Tester and an intermediate node/router in the network path)
RTT for end-to-end communications
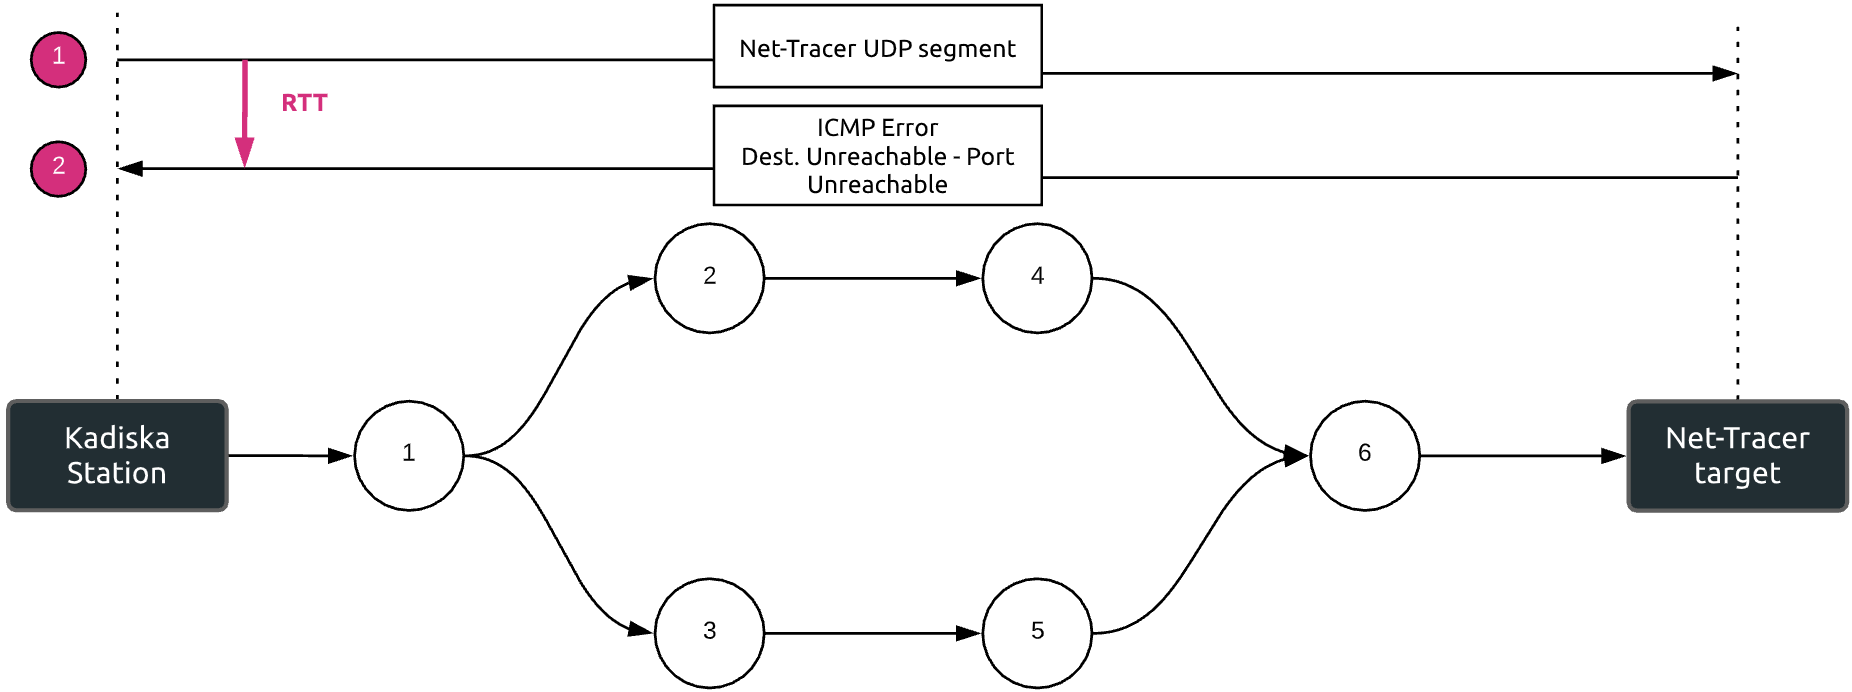
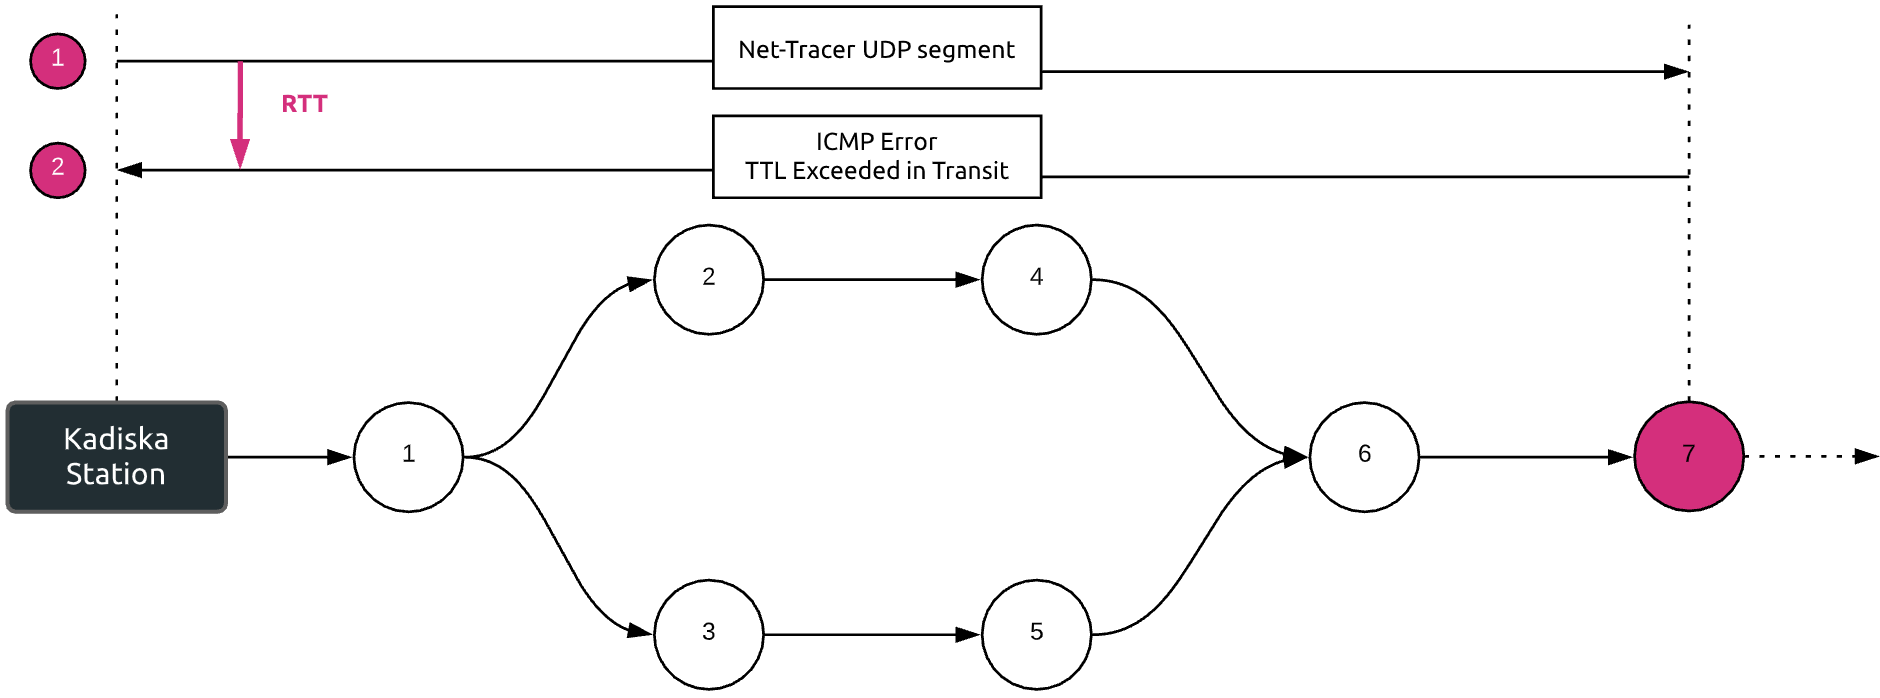
In the context of Kadiska Net-Tracer, RTT for end-to-end communications is the time elapsed between the following events:
- The Kadiska Tester sends a Net-Tracer test to the target
- The target responds with an ICMP error message (Destination Unreachable - Port Unreachable) back to the Kadiska Tester
Important remark:
Depending on the Net-Tracer method used, the target may be reached or not. If the target is not reached, the RTT value takes the furthest discovered router into account. This is why Kadiska refers to "furthest" for this kind of metric.
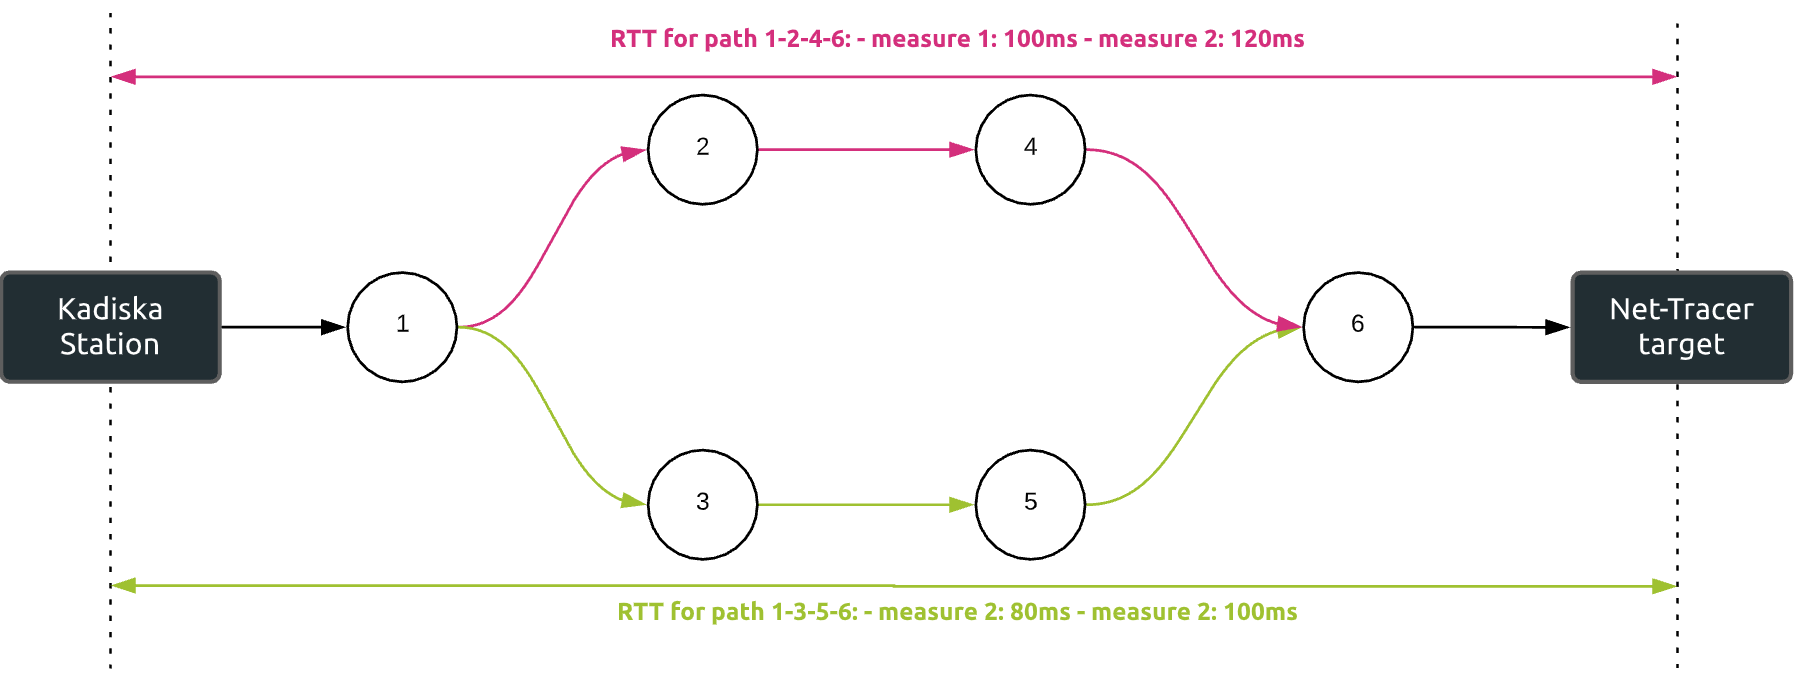
In order to compute the RTT for end-to-end communications, Kadiska takes all Net-Tracer tests as well as all possible paths into account and calculates the average value:
RTT = (∑RTT Net-Tracer tests) / #tests
In the example below, RTT = measure 1 for path 1-2-4-6 (100ms) + measure 2 for path 1-2-4-6 (120ms) + measure 1 for path 1-3-5-6 (80ms) + measure 2 for path 1-3-5-6 (100ms) / 4 = 100ms.
In the Kadiska platform, this end-to-end RTT value, called "latency", is provided in different dashboards.
First, in the "Network Overview" view, latency is provided by Net-Tracer target.
The map represents the latency value grouped by Kadiska Testers and countries.
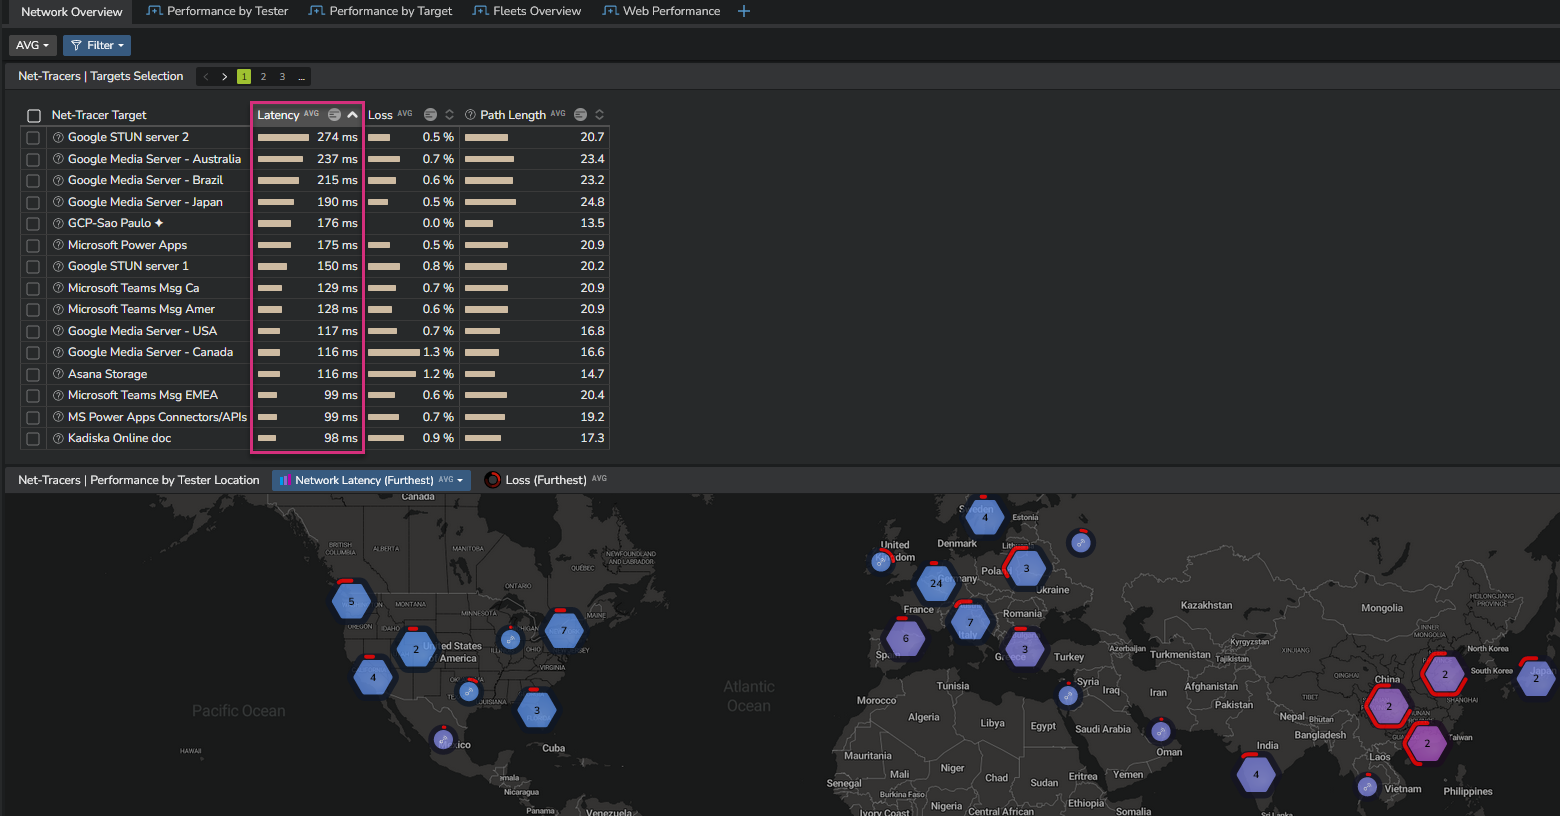
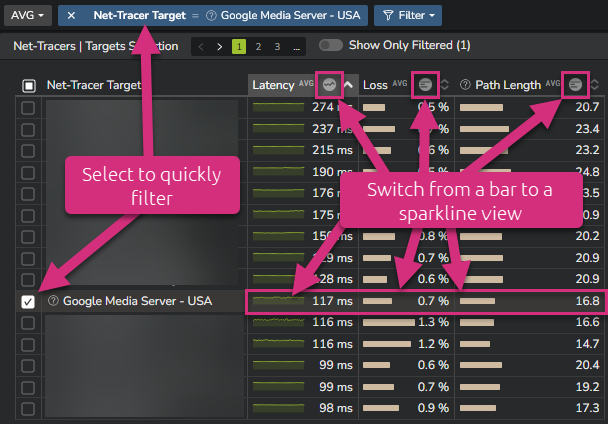
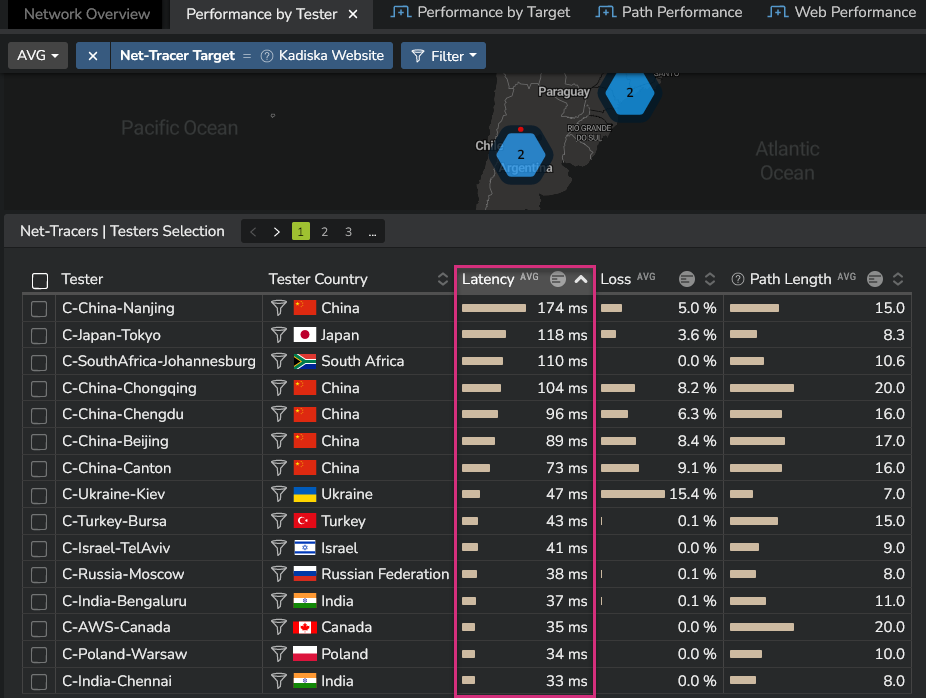
Quick tips (see picture below):
- For each metric, you can easily switch from a bar to a timeseries representation
- You can select one or multiple Kadiska Net-Tracer target(s) to further filter on it(them)
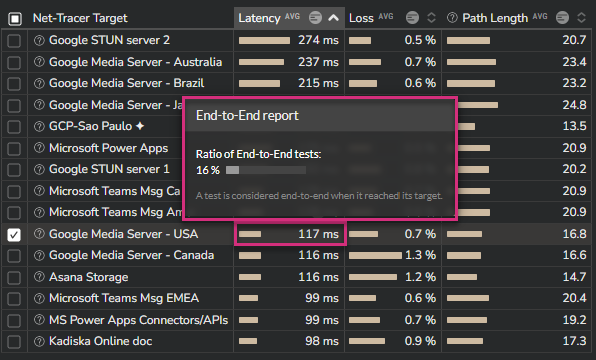
Furthermore, the latency values can be a mix of "furthest" and "end-to-end" measurements.
In such a case, the reported values correspond to the "end-to-end" measurements only, as these correspond to the Tester(s) reaching the target(s).
Mouse over any value to see the percentage of end-to-end measurements.
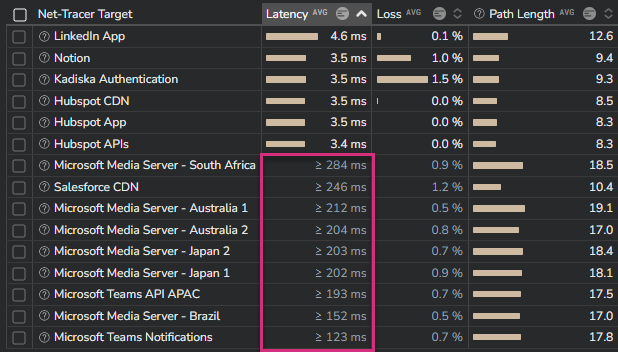
In case the target is never reached (there are only "furthest" measurements), then the value is greyed out and is preceded by the ">=" sign to indicate that the latency between the Tester and the target is greater than the provided partial value.
Notes:
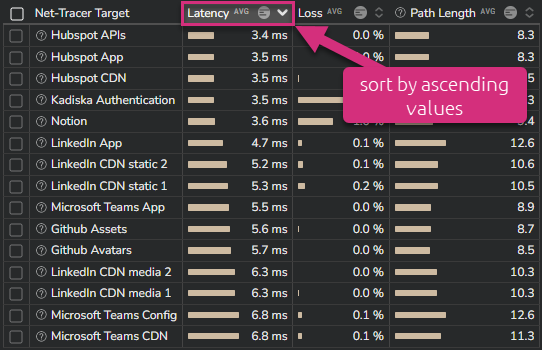
By default, the values are sorted by end-to-end (descending) values, then by furthest (descending) values.
You can reverse the sorting (ascending) by clicking on the corresponding column name.
You can click on any column name to sort by the corresponding values (ascending or descending).
Moving to the "Performance by Tester" or "Performance by Target" next dashboard keeps the filter(s) you previously defined.
These views provide the latency value respectively by Kadiska Tester and by Tracer target.
The following example shows the top 10 highest latency values by Kadiska Tester targeting the Kadiska website (www.kadiska.com).
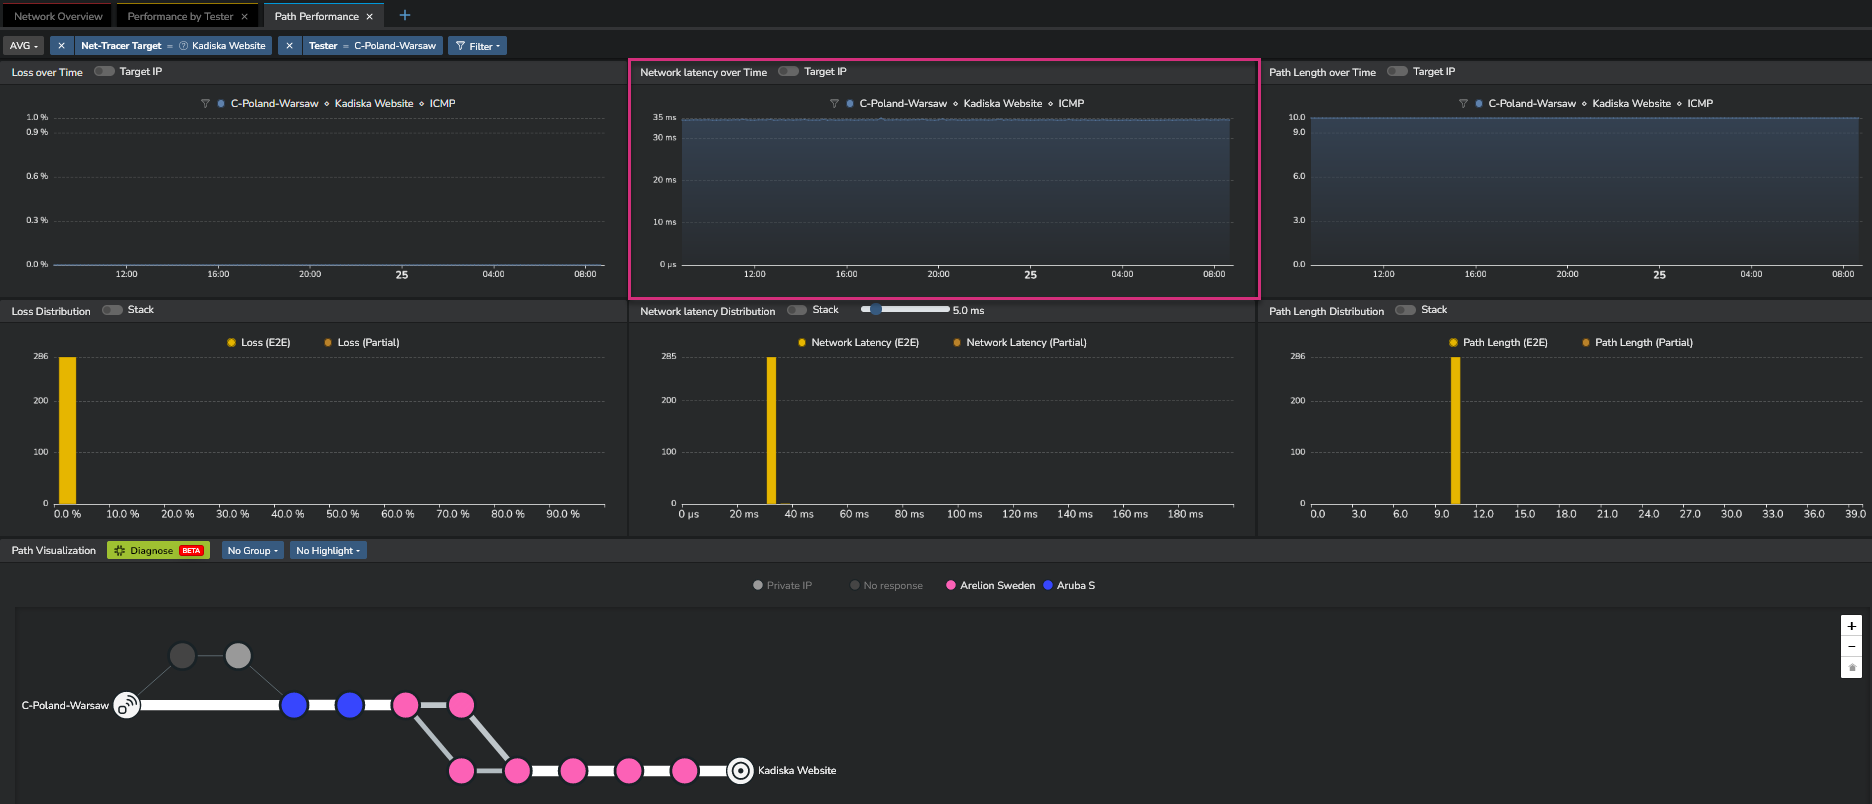
Finally, the latency value is provided in the "Path Performance" section as a timeseries graph:
RTT for intermediate nodes
In the context of Kadiska Net-Tracer, RTT for intermediate nodes is the time elapsed between the following events:
- The Kadiska Tester sends a Net-Tracer test to the node
- The node responds with an ICMP error message (TTL Exceeded in Transit) back to the Kadiska Tester
So this RTT value is calculated at each node level.
This is computed based on all values from all Net-Tracer tests and all Kadiska Testers (in case multiple Kadiska Testers share the same node in their respective network paths):
RTT = (∑RTT Net-Tracer tests from all Kadiska Stations) / #tests
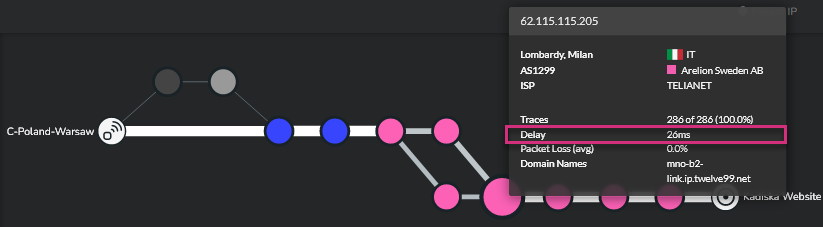
In the Kadiska interface, this value is provided when you mouse over any node in a path visualization, and is called "Delay":