Wi-Fi and Cellular metrics for Fleets
Deploying the Kadiska Tracer on fleets enables the collection of additional metrics related to last mile network performance, compared to Enterprise Station deployment. The last mile can be either a WiFi or a cellular connection.
Fleets overview
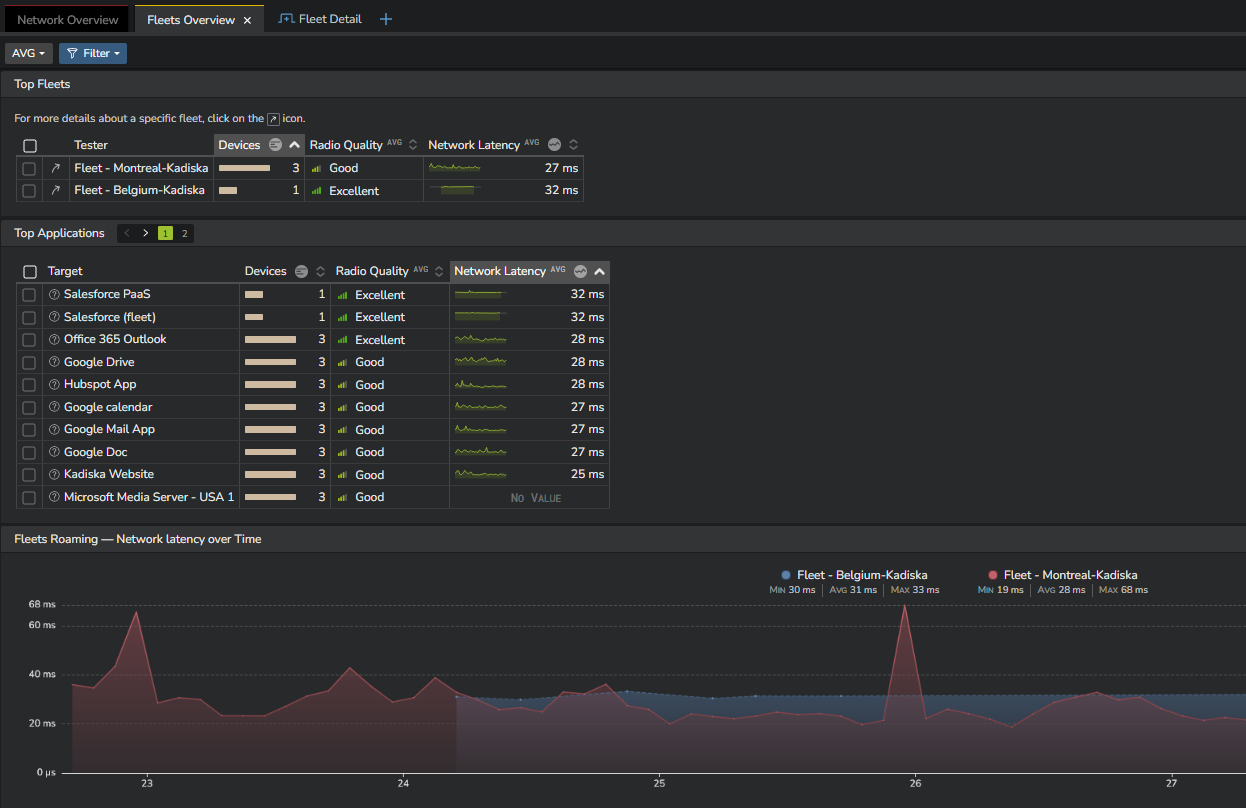
In the "Fleet Overview" dashboard, you can monitor the global network connectivity health for each deployed fleet, as well as for each targeted Net-Tracer (application).
For example, in the context of large-scale retail deployment where a fleet typically corresponds to a store, these tables can help you identify any network connectivity degradation that may be limited to one or more specific stores. They can also help you determine if this degradation affects specific targets (applications) that are used by the stores.
Metrics provided in these first tables are:
- Number of devices within each fleet from which performance metrics have been collected. This enables you to estimate the scope of the degradation and the number of impacted users in case of any degradation.
- Radio quality, which serves as a valid quality indicator for both WiFi and cellular networks. We categorize quality levels as "Excellent", "Good", "Fair", or "Bad", depending on the level of performance.
- Network latency measure and evolution when activating the "Sparkline" view mode.
Fleet details
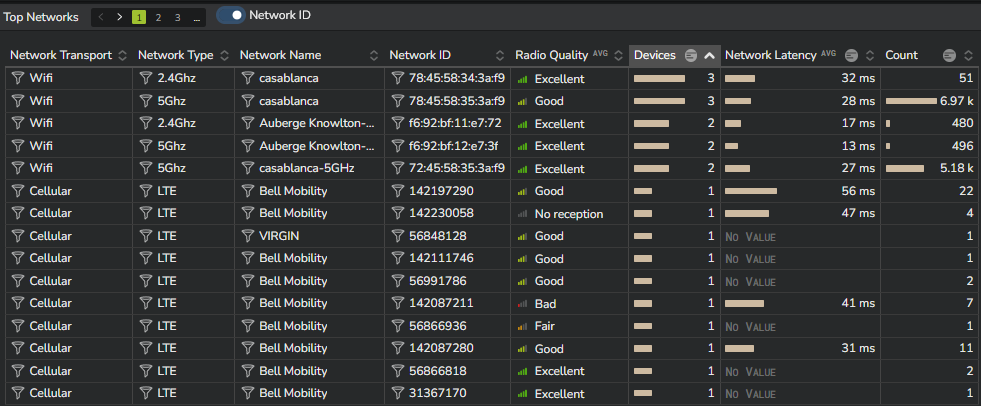
The "Fleet Details" dashboard allows you to focus on a specific fleet (or a limited number of fleets) and obtain more detailed information. The "Top Network" table enables you to differentiate between different Wi-Fi and cellular networks. By activating the "Network ID" switch, you can also identify each individual access point based on its BSSID.
For each individual network transport / network type / network name combination, you can monitor the following:
- Radio quality
- Number of connected devices
- Network latency to all configured Net-Tracer targets
You can also determine the relevance of these measurements by examining the "Count" column, which displays the number of tests performed during the chosen time frame.
With this information, it becomes easy to identify any poorly performing Wi-Fi network segments or abnormal roaming from Wi-Fi to cellular networks.
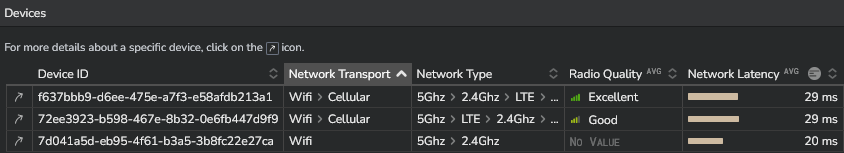
The next table provides the list of all devices. These are identified by their respective IMEI (International Mobile Equipment Identity).
For each individual device, you can see all network transports and types they connected to, as well as the average radio quality and network latency to all configured Net-Tracer targets.
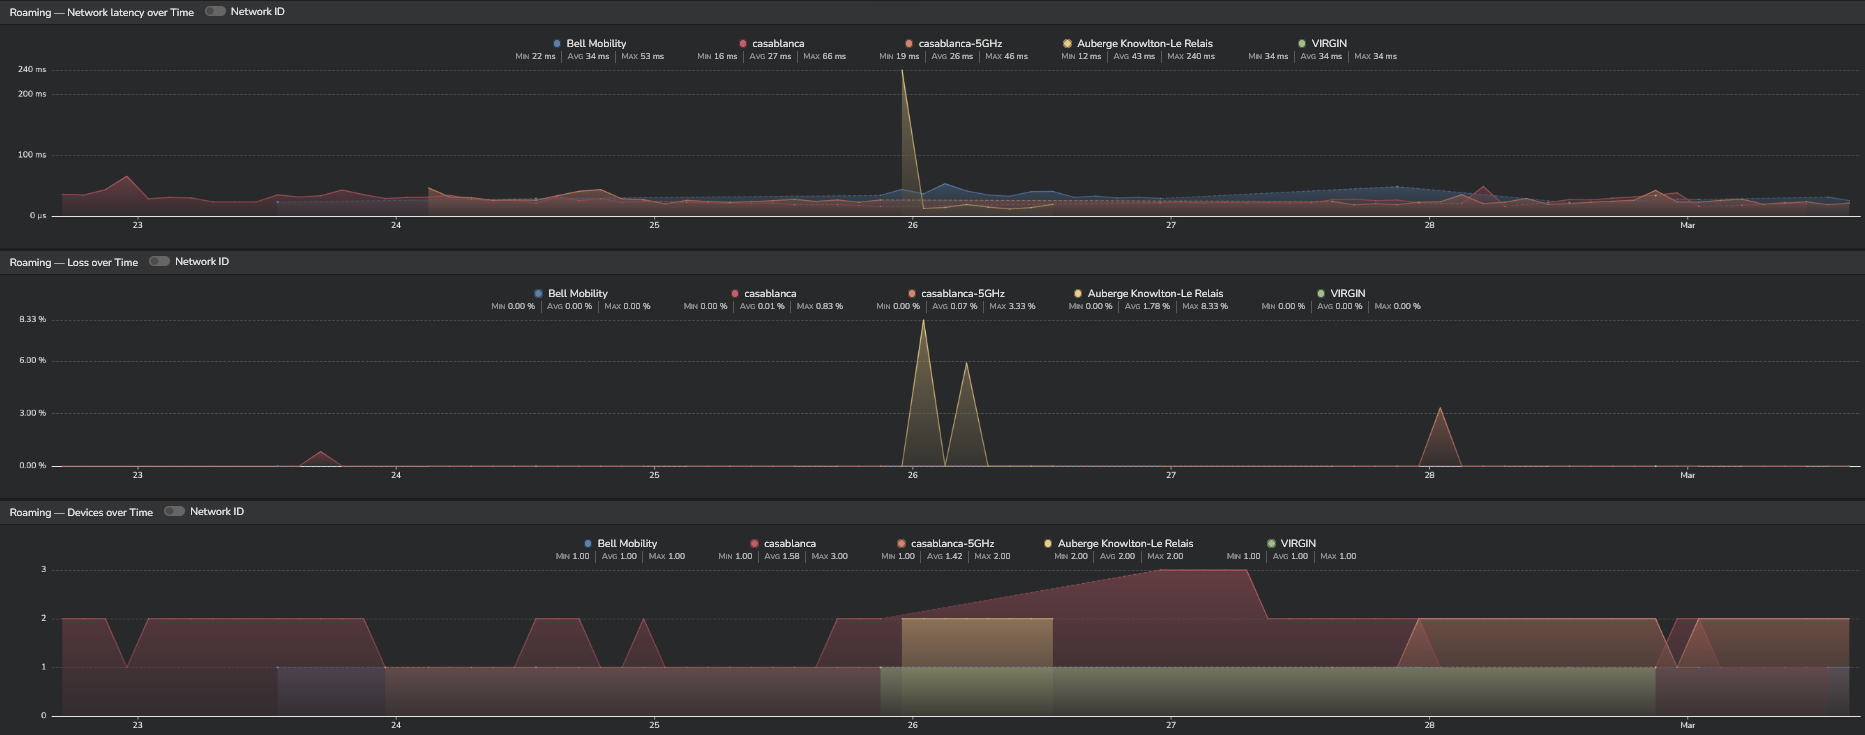
Finally, this "Fleet Detail" dashboard provides timeseries that show the evolution of network latency, packet loss, and the number of connected devices over time. You can group these timeseries by either network type (WiFi or cellular) or network IDs (WiFi access points or cellular antennas). The goal of these timeseries is to help you easily identify when specific networks were used and if they had any impact on the average network latency.
Device details
If a user reports performance degradation, you may want to investigate the changes in connectivity contexts that the user experienced. To do so, navigate to the "Device details" dashboard.
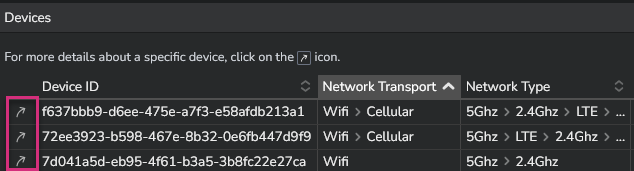
Access to this dashboard is only available through the "Fleet dashboard" by clicking on the arrow beside each device, as shown in the screenshot below.
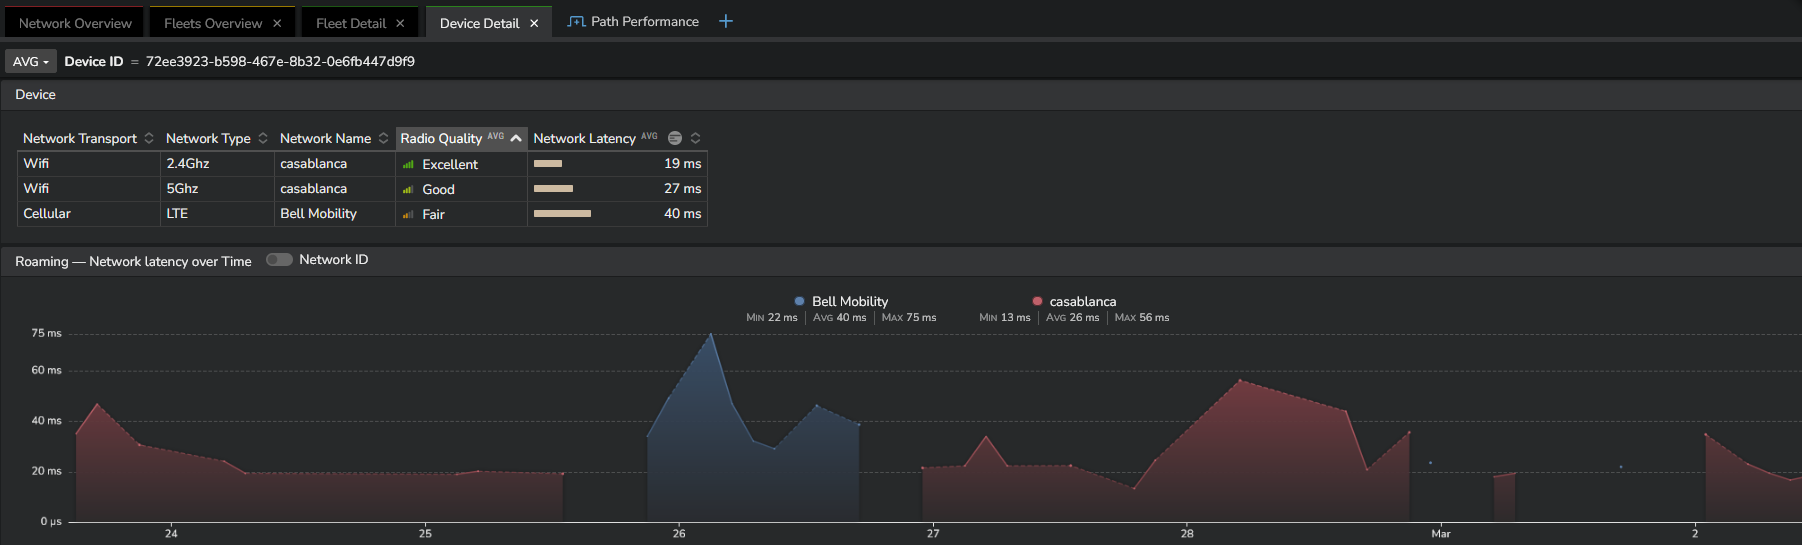
The "Device Details" dashboard displays a list of all networks on which the device has connected during the selected time frame. It also provides corresponding network performance metrics, as well as radio quality. These performance metrics are presented in a timeseries format, enabling easy identification of any abnormal or suboptimal roaming that could negatively impact performance and user experience.
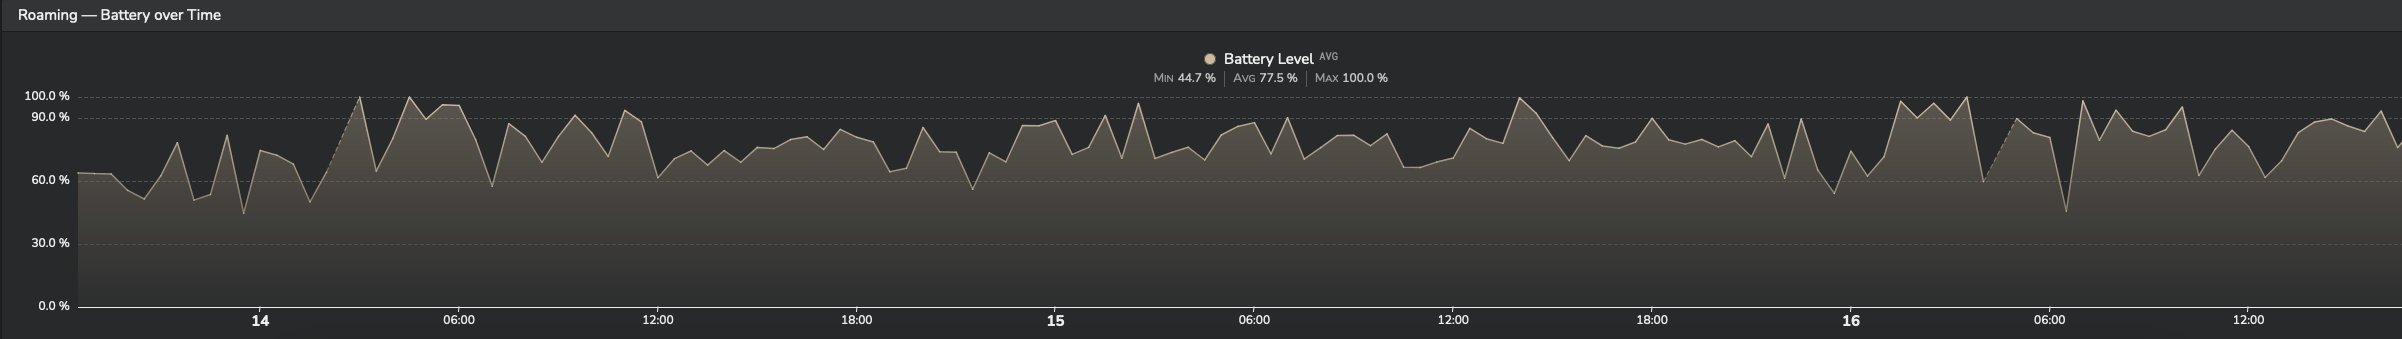
Finally, the last timeseries shows the evolution over time of the device's battery level so that you can check whether potential performance degradations are related to specific battery status.
Path performance
Remember that the Path Performance dashboard remains available to you. This dashboard provides information on any network path taken by any fleet or specific device.