Server time
The Server metric corresponds to the time between the Tester sending an HTTP(s) request to the HTTP-Tracer target, and the target sending the first packet (which includes the response status code) back to the Tester.
This metric is available in different dashboards.
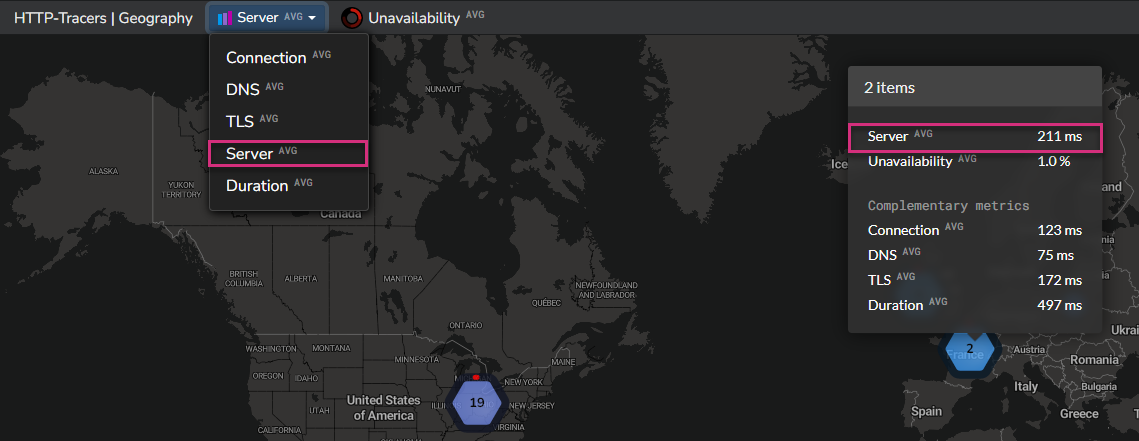
First, it is provided on maps.
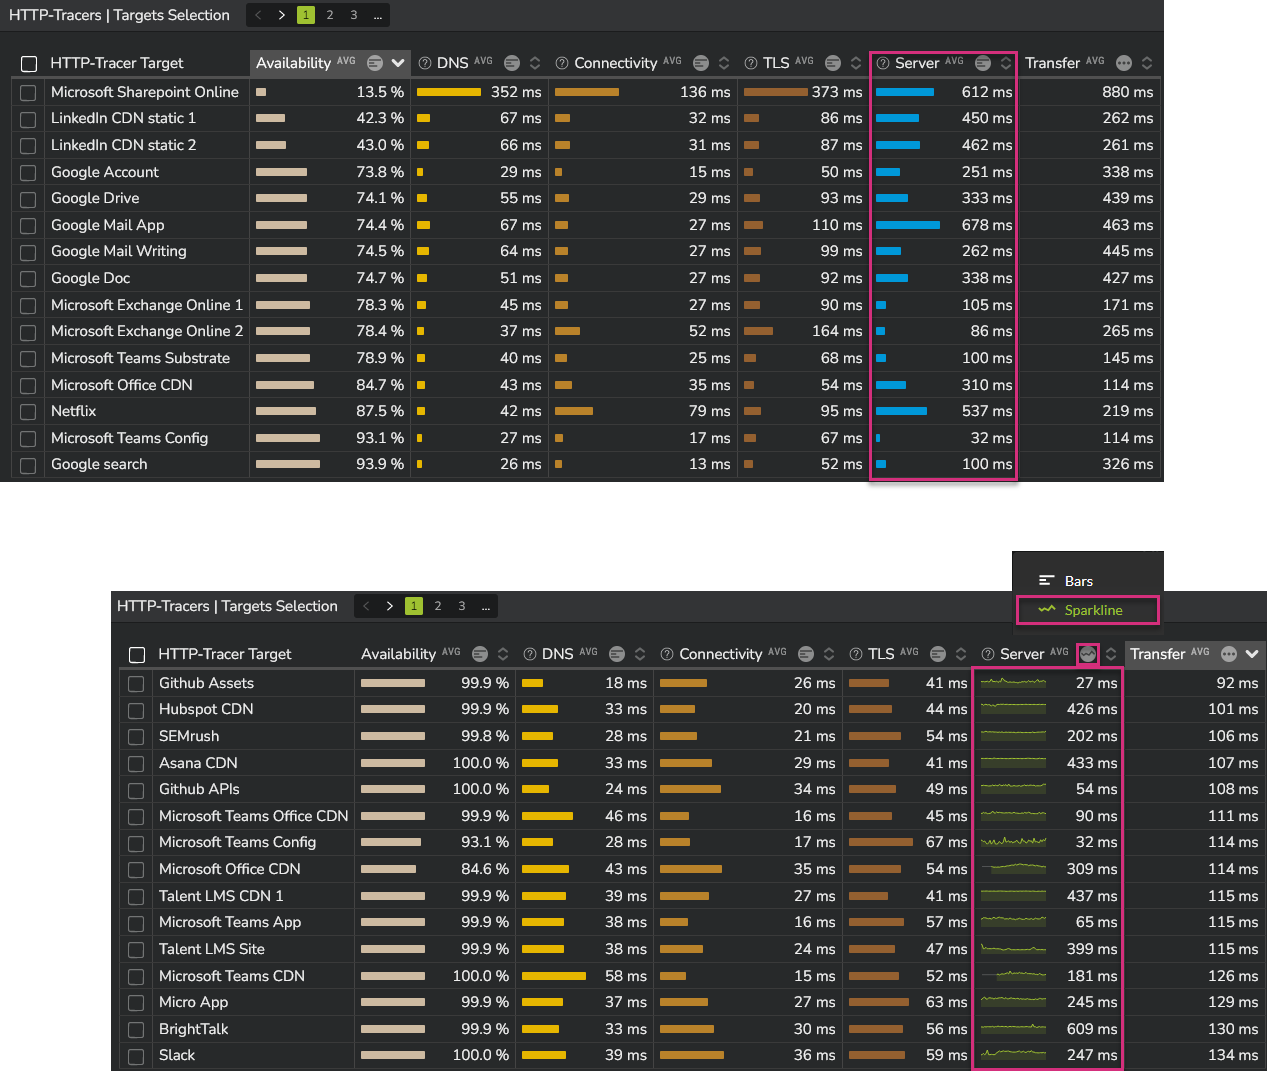
It is also provided in different tables in the dashboards "Network Overview", "Performance by Tester" and "Performance by Target". Activating the "sparkline" option allows you to see the evolution over time, right from the table:
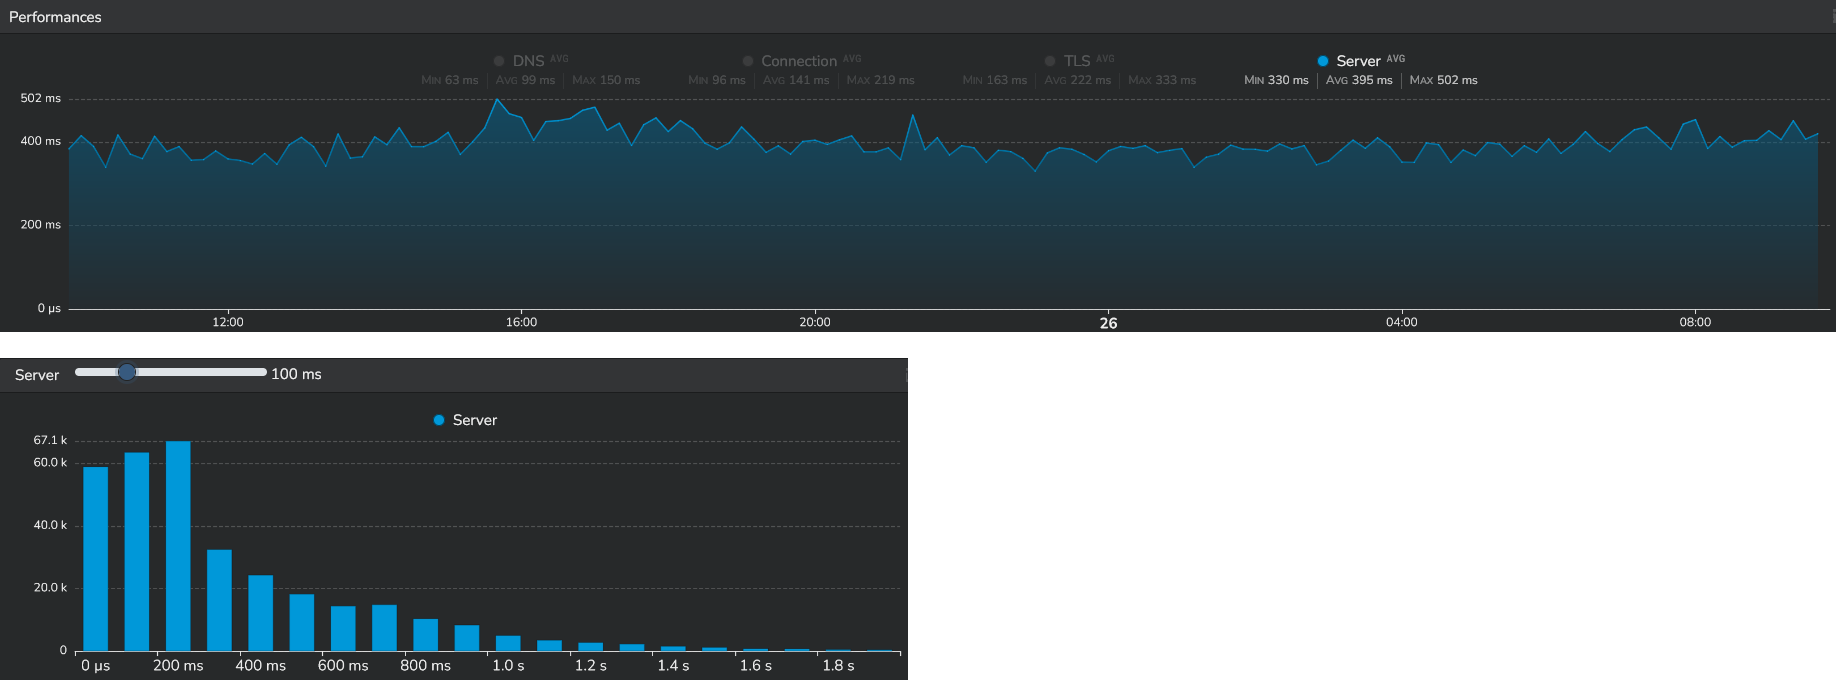
Finally, the "Web performance" dashboard provides the evolution over time of this metric, as well as the distribution graph.
Important note:
When redirections occur, the server time value corresponds to the sum of all server times measured for each redirection, up to the final destination.