Release Note: May 2022
Improved Watcher performance drivers identification
When troubleshooting performance issues, one of the first questions we want to be able to answer quickly is: "What's the main performance driver?".
This question can be answered by looking at the main Watcher performance metrics:
So far, metrics that reported a value of 0ms were not taken into account for the average/P50/P75/P90 global metric value calculation. This could lead to the troubleshooter focusing his/her attention on a metric that was finally not the main performance driver.
In the newest version of the product, the performance metrics do take 0ms values into account.
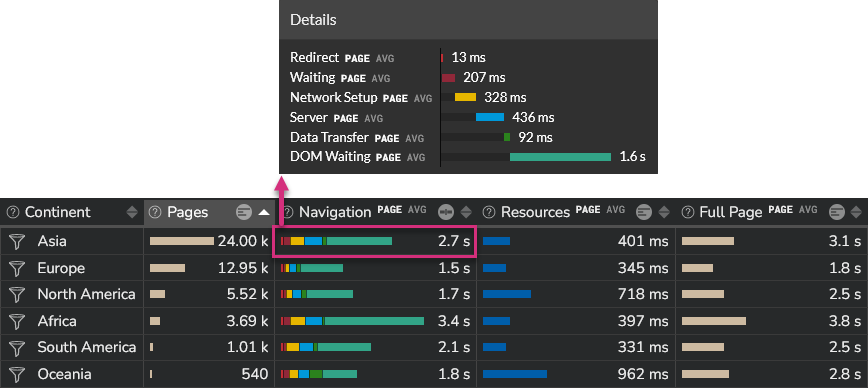
Let's take a real example to understand what this is all about.
In the screenshot above, you notice that the average network setup part is 328ms.
In the previous version of the Kadiska platform, this high latency could only impact one user, while being reported as one of the major performance drivers in the Kadiska interface. The reason for this is that lots of users sessions could skip this network setup phase thanks to DNS cache and already established TCP sessions. Skipping the network setup phase means that DNS and CT metrics = 0ms, and as mentioned above, these values were not considered in the total calculation. So you could end up troubleshooting a problem for which the scope of impact was very low.
Seeing that we now take the 0ms value into account, such a high value really means that lots of network connections were experiencing a bad network performance. This is confirmed on the following network dashboard view:
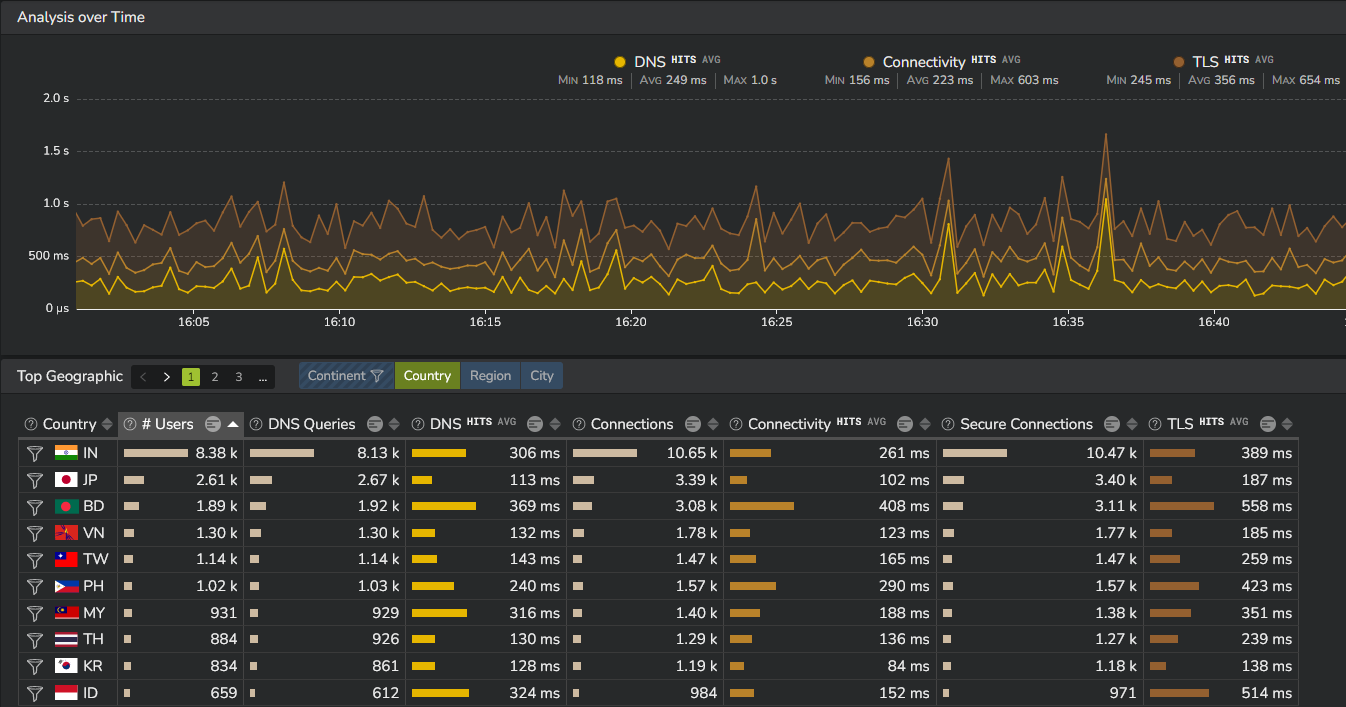
You may argue that you are not able anymore to detect any network degradation that would affect a small portion of the users as the average network connection value may be greatly decreased by all 0ms iterations. Rest assured! The network performance related dashboards address this challenge by not taking 0ms value into account, so that all timeseries and tables provide values that relate to effective network transactions. So one specific slow transaction will still be detected!
Performance of CORS resources
In the previous release of the Kadiska platform, transactions related to CORS could not be analyzed from a performance standpoint. No metric could be reported due to the principle of CORS itself (please refer to this article for more details).
Even if this CORS limitation still applies today, we are now able to calculate the whole duration of a resource fetch, even in CORS conditions.
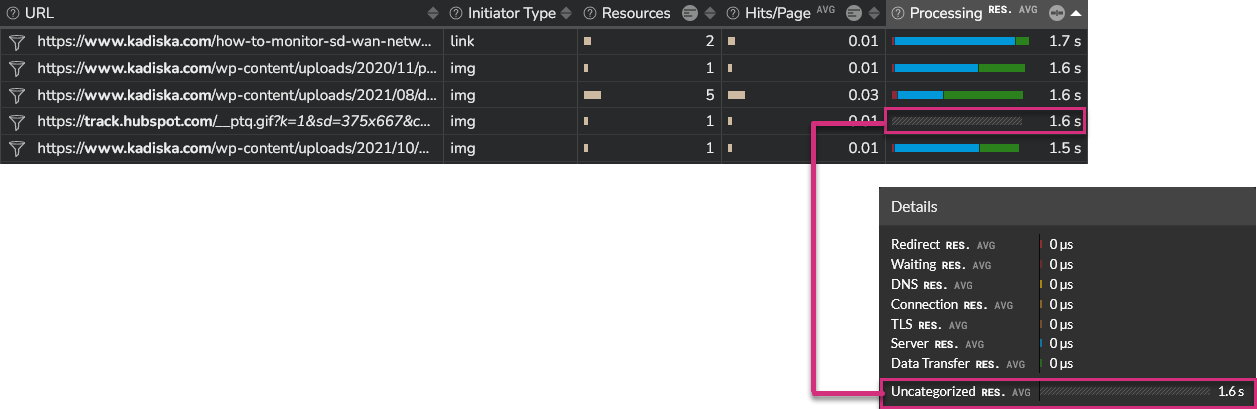
Concretely, this means that you can easily identify resources that significantly impact overall application performance.
The example below illustrates it. On the picture, you see that there is an image that took 1.6 seconds to be fetched by the browser. Even if we are not able to report detailed metrics, the whole duration of the fetch transaction is reported and can be used to assess resources related performances.
Identification of CORS transactions
Previously, the percentage of transactions related to CORS resources was provided in a specific column:
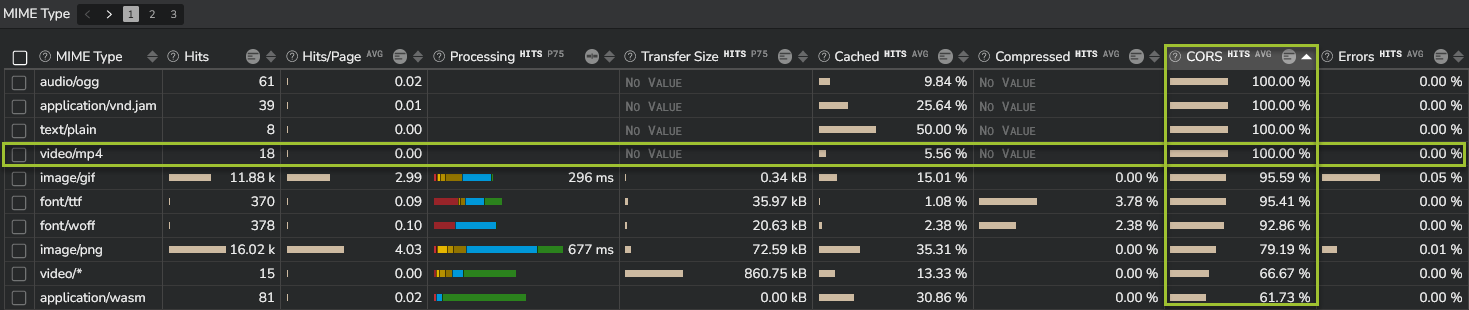
More precisely, this value corresponded to the percentage of transactions related to CORS resources for which no performance metric could be reported due to the absence of TAO (Time Allow Origin) header in the HTTP(S) response.
You'll not find this column anymore in the newest product release. Instead, this percentage is provided in a new metric called Uncategorized:
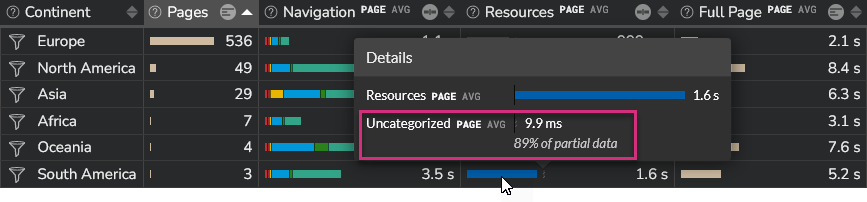
In the example above, the Resources time is provided for all type of resources:
- All resources for which performance metrics are collected represent an average resource time (average time to fetch all resources) of 1.6s
- All resources for which no performance metrics can be collected (mainly due to CORS with TAO limitation) represent an average resource time of 9.9ms. In addition, the percentage of these resources is also provided (89% in this specific case).
Web transactions methods, responses and errors
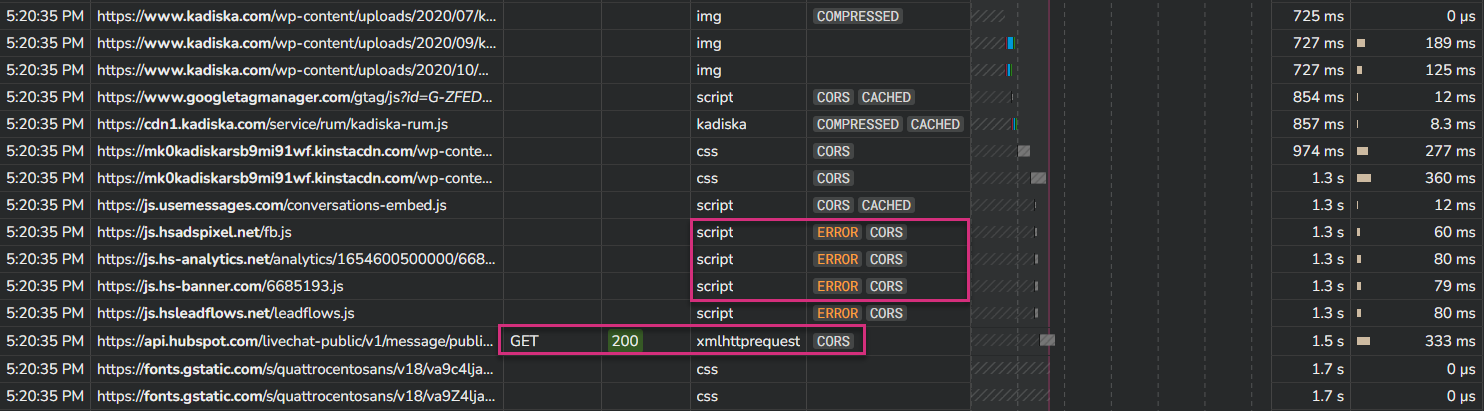
In case you use the Kadiska User-Watcher to collect performance metrics, we now provide the HTTP(S) method and status code for resources requested through either fetch or xmlhttprequest initiator type.
In addition to this new capability, we also now inform you in case fetching a specific resource failed (ERROR message):
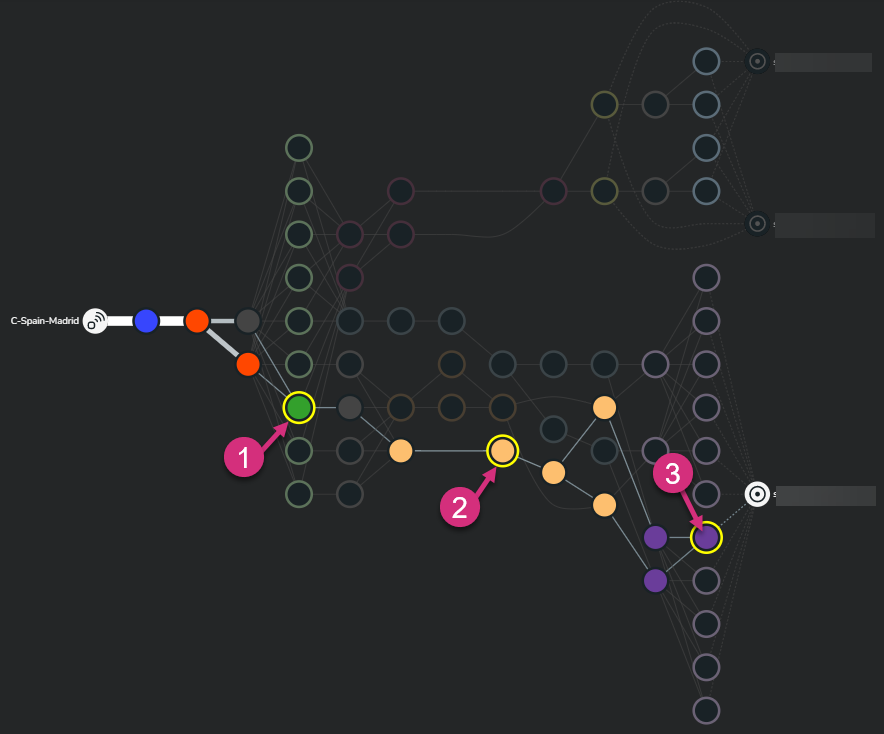
New network path visualization capabilities
The look and feel of the network path visualization has been reviewed to improve user experience.
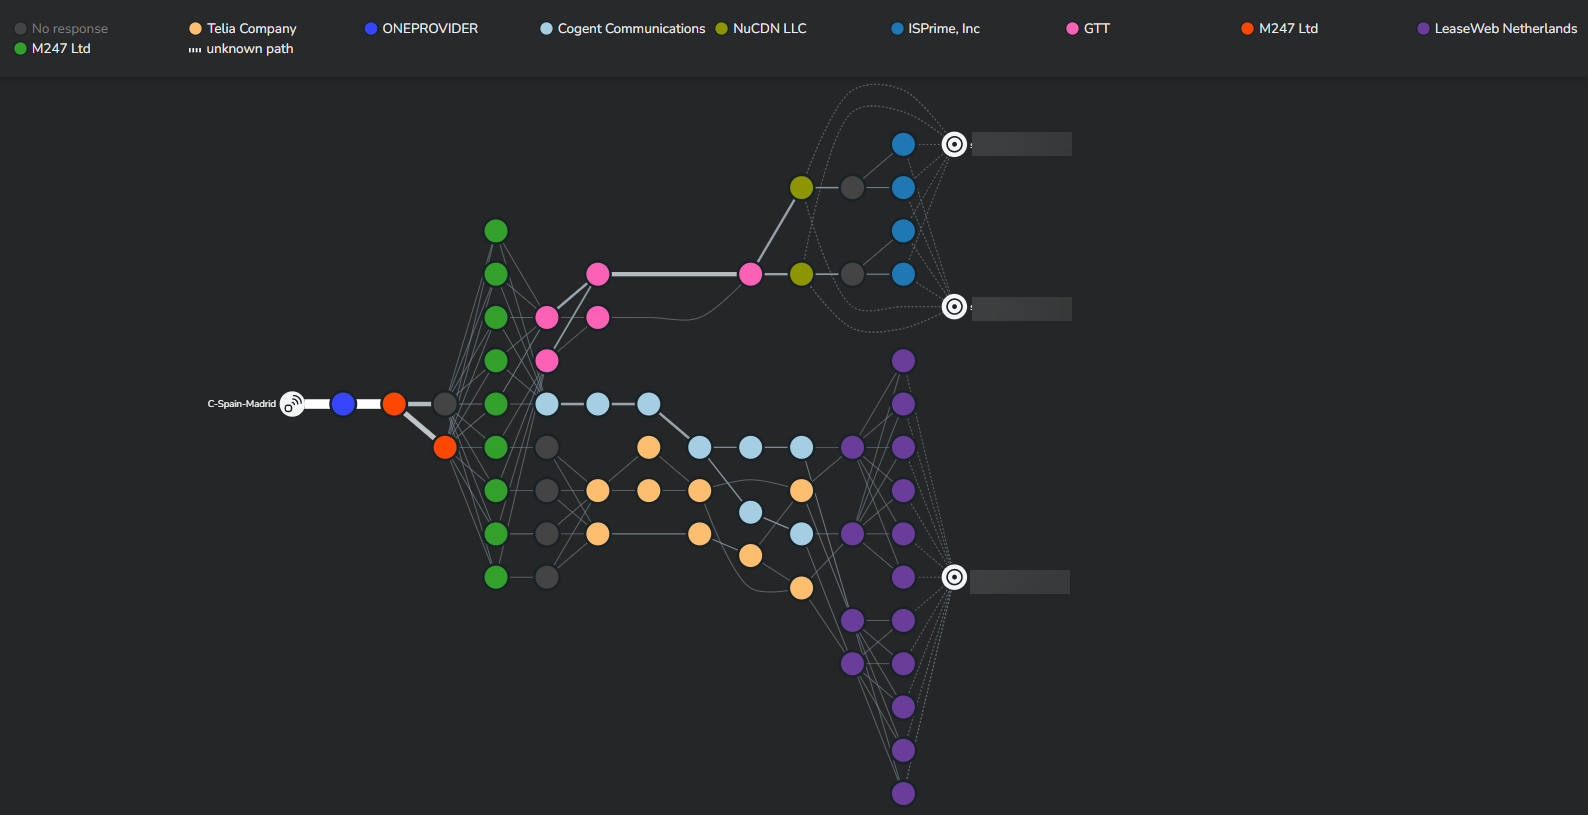
For example, the focus mode let's you better discover all corresponding paths, without losing information about paths that are out of focus.
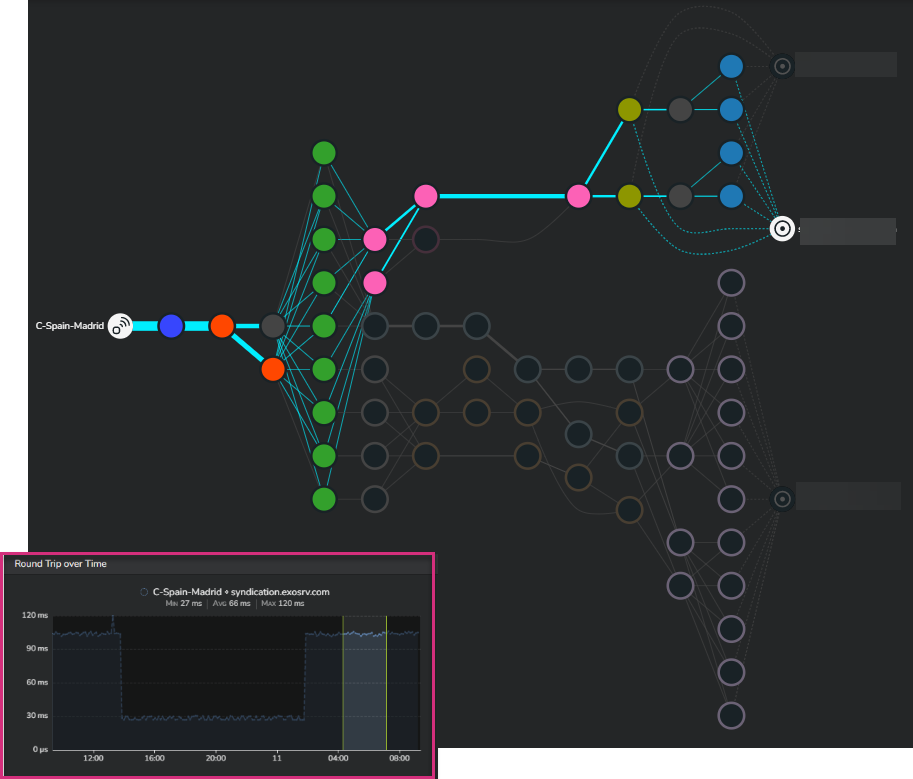
The coolest feature introduced is the possibility to freely select multiple nodes to automatically and instantly discover corresponding end-to-end paths. This can for instance be really helpful in situations where performance of some nodes is degraded. You can determine all upstream connections impacted as well as corresponding destinations hosts (in case of multiple DNS resolutions).
For this, just click on the different nodes of interest while holding the SHIFT button.