Availability and Errors
The availability of an HTTP-Tracer target is the percentage of HTTP-Tracer tests for which the target responded back to the Tester within the configured response code range.
By default, as explained in the HTTP-Tracer creation section, the range 200-299 is proposed. This range typically relates to successful HTTP requests.
You can configure any valid HTTP status code as expected response code according to your specific requirements.
However, note that when the response code matches the configured expected response code, it is systematically considered in the "Availability" calculation.
Example: If you configure the status code 404 as expected response code, then systematic 404 responses will mean an "Availability" of 100% (which makes no sense).
When the HTTP Tracer is not successful, Kadiska let's you know the reason for this failure.
Supported errors messages are:
| Error message | Description |
|---|---|
| DNS | The tester was unable to resolve the targeted domain name |
| Connect | The tester was unable to connect to the target |
| TLS | The tester was unable to establish a secure connection with the target |
| Timeout | The target did not respond within the time frame configured in the "timeout" parameter |
| No response | The Tester did not receive any response from the target. However, the connection was correctly established and terminated |
| Too many redirects | There were too many redirections before reaching the target, as configured in the "Redirect" parameter |
| Non matching statuses | The response code was not in the range of configured expected status codes |
| HTTP2_STREAM | Stream error in the HTTP/2 framing layer |
| RECV | May happen when the connection to the server is closed while still receiving response from the server |
| SEND | May happen when the connection to the server is closed while still uploading data to the server |
The details of the errors evolution is provided in the "Web performance dashboard":
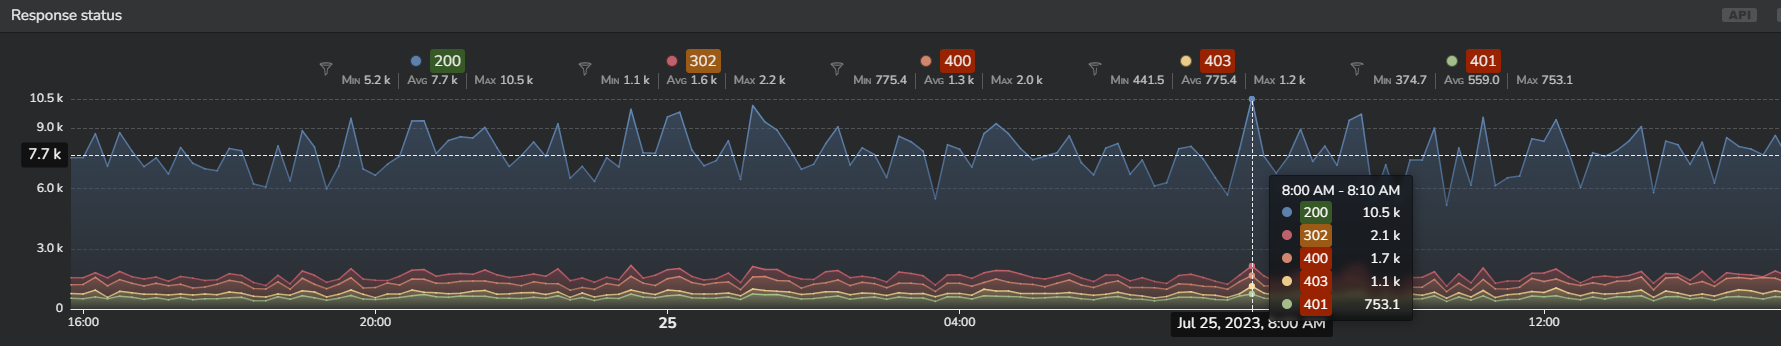
Tip:
To only visualize data corresponding to one specific error code, simply click on the code number. "SHIFT + CLICK" will exclude one specific error code from the timeseries. "CLICK + HOLD SHIFT & CLICK" allows you to select multiple error codes in the visualisation.
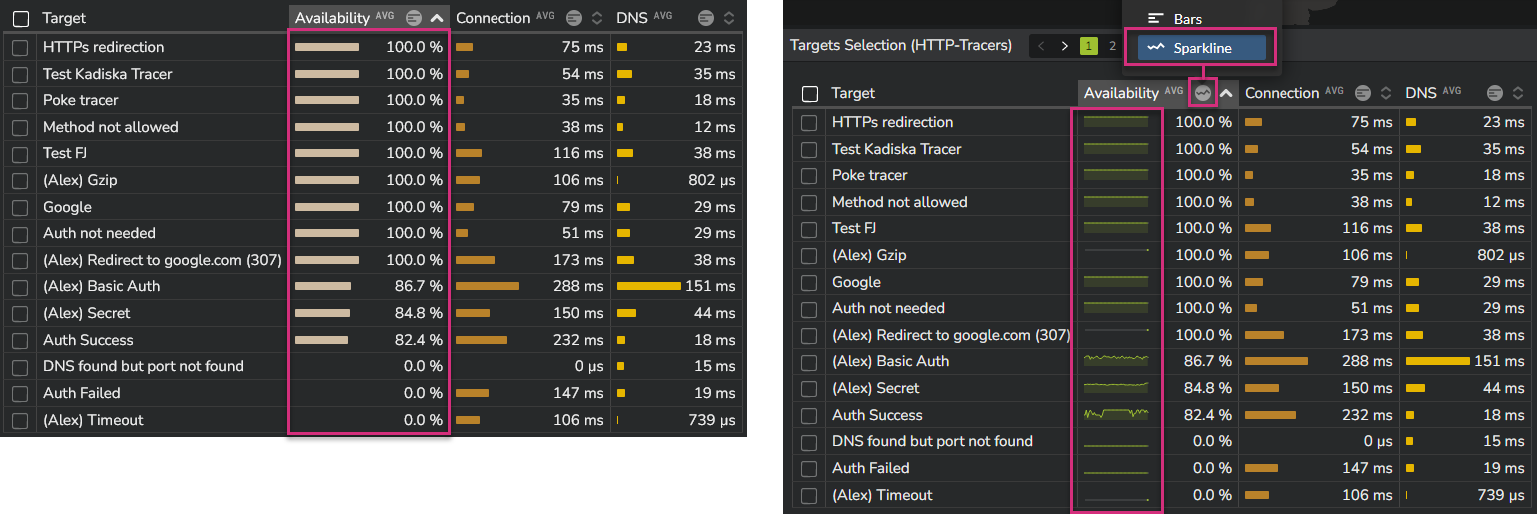
The availability metric is shown in different dashboards.
It is provided in different tables in the dashboards "Network Overview", "Performance by Tester" and "Performance by Target". Activating the "sparkline" option allows you to see the evolution over time, right from the table:
The "Web Performance" dashboard provides the overall availability as well as all corresponding errors that occurred during the selected time frame.
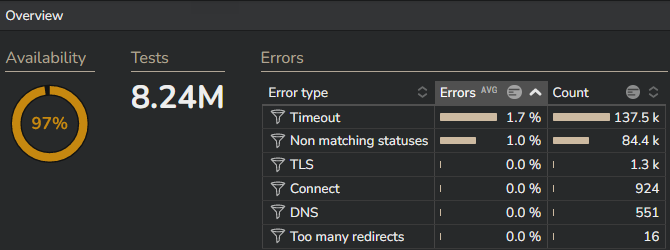
This dashboard also allows you to identify the servers that are delivering the web service you are targeting. The availability metric is then provided by server, as well as per users' location.
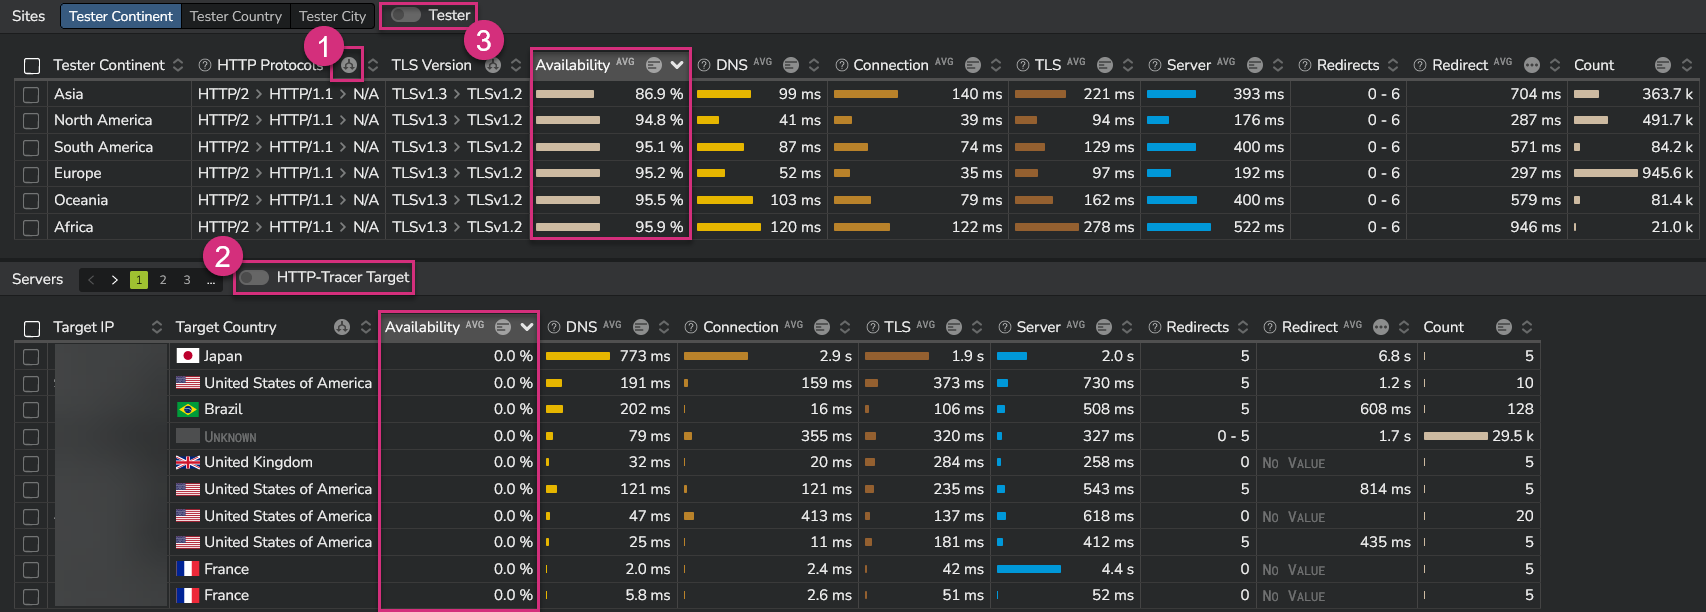
By default, the data are grouped by HTTP protocol and TLS version (in case of HTTPS tests).
If you want to get the details per protocol or per TLS version, simply click on the ![]() icon at the top of the related column.
icon at the top of the related column.
If you have not filtered on any specific HTTP-Tracer target while navigating to the Web performance dashboard, you may want to quickly select one. To ease this process, you can click on the "HTTP-Tracer Target" switch (2) to see all targets.
Finally you can also see the details by Tester (and potentially focus on data collected from one or multiple specific Testers) by selecting the "Tester" switch (3).