News: November 2020
Navigation enhancements
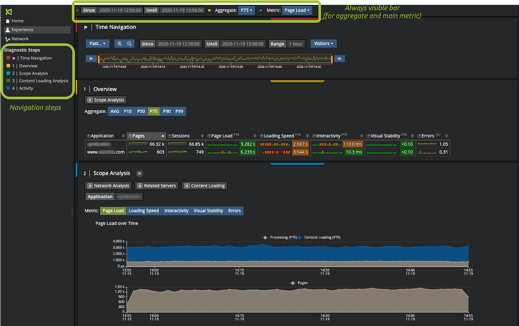
- Aggregate, timing and main metric are always visible at the top of the UI
- A side bar keeps track of all the steps taken in a diagnostic to make the navigation back and forth more intuitive.
Filtering and Aggregating
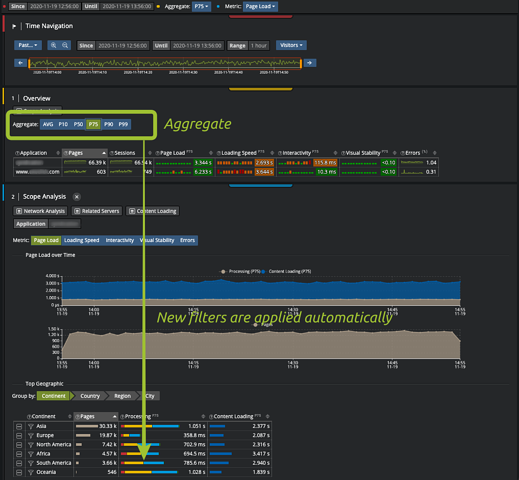
- Changes in filters now automatically apply to the following steps to help you run diagnostics faster
- You can now choose your main aggregate and change it any time (average, percentiles from 10 to 99).
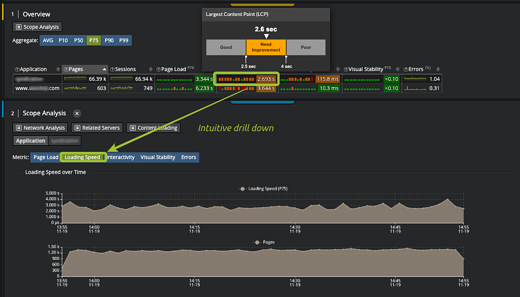
More intuitive drill downs
Clicking on a specific metric will drive you to the next step for that indicator automatically.
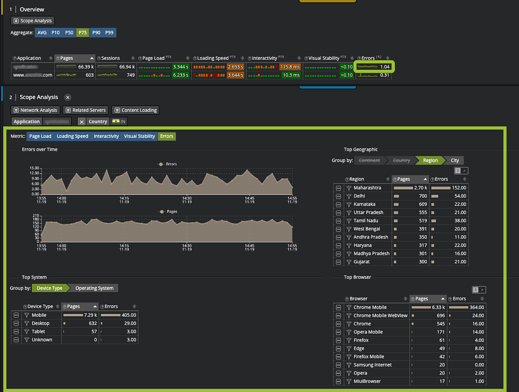
Focus on Errors
A specific drill down has been added for Errors to help your team understand the scope of errors (which devices, browsers and transactions) at a glance.
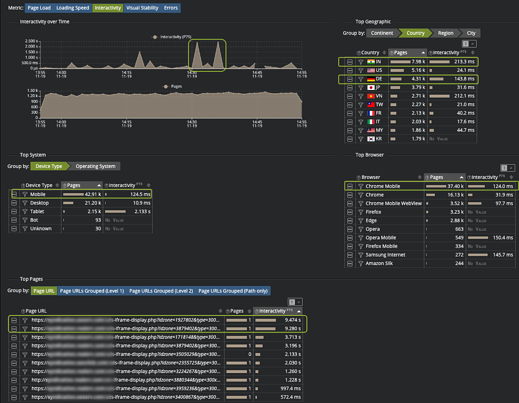
Fine-tuned "Scope Analysis" screen
Many improvements on this screen to help you get the scope and impact of a specific performance problem.
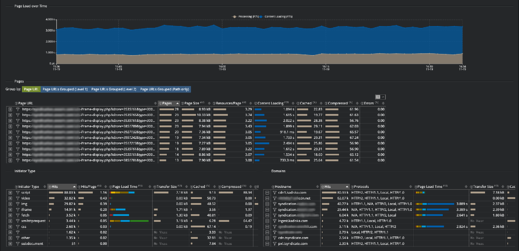
Enhanced "Content analysis" screen
This will help you understand in seconds which contents (scripts, images, CSS) slowdown your app and whether they are provided by your app, a CDN or 3rd party.
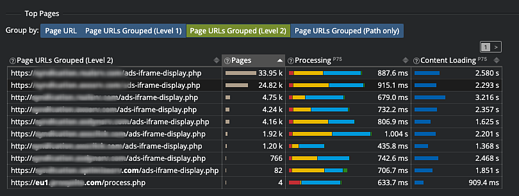
URL Grouping
To fasten your analysis, Kadiska is now capable of automatically grouping URLs to isolate a degradation.