Packet loss (end-to-end)
In order to compute network performance metrics, like RTT and packet loss, Kadiska Stations perform Net-Tracer tests to targets. Please refer to the "RTT for end-to-end communication" paragraph of the RTT section to learn more about how these tests are performed.
For each Net-Tracer test sent by a Kadiska Station to a Net-Tracer target, Kadiska counts the number of times the target does not respond. From all Net-Tracer tests, the packet loss metric, expressed in percentage, is calculated as follows: Packet loss = #no response from the target / #Net-Tracer tests to the target. Depending on the Net-Tracer method used, the target may be reached or not. If the target is not reached, the packet loss takes the furthest discovered router into account. This is why Kadiska specifies "Furthest" for this kind of metric.
Important remark: In order to guarantee correct end-to-end packet loss calculation, please make sure to comply with the Net-Tracer requirements.
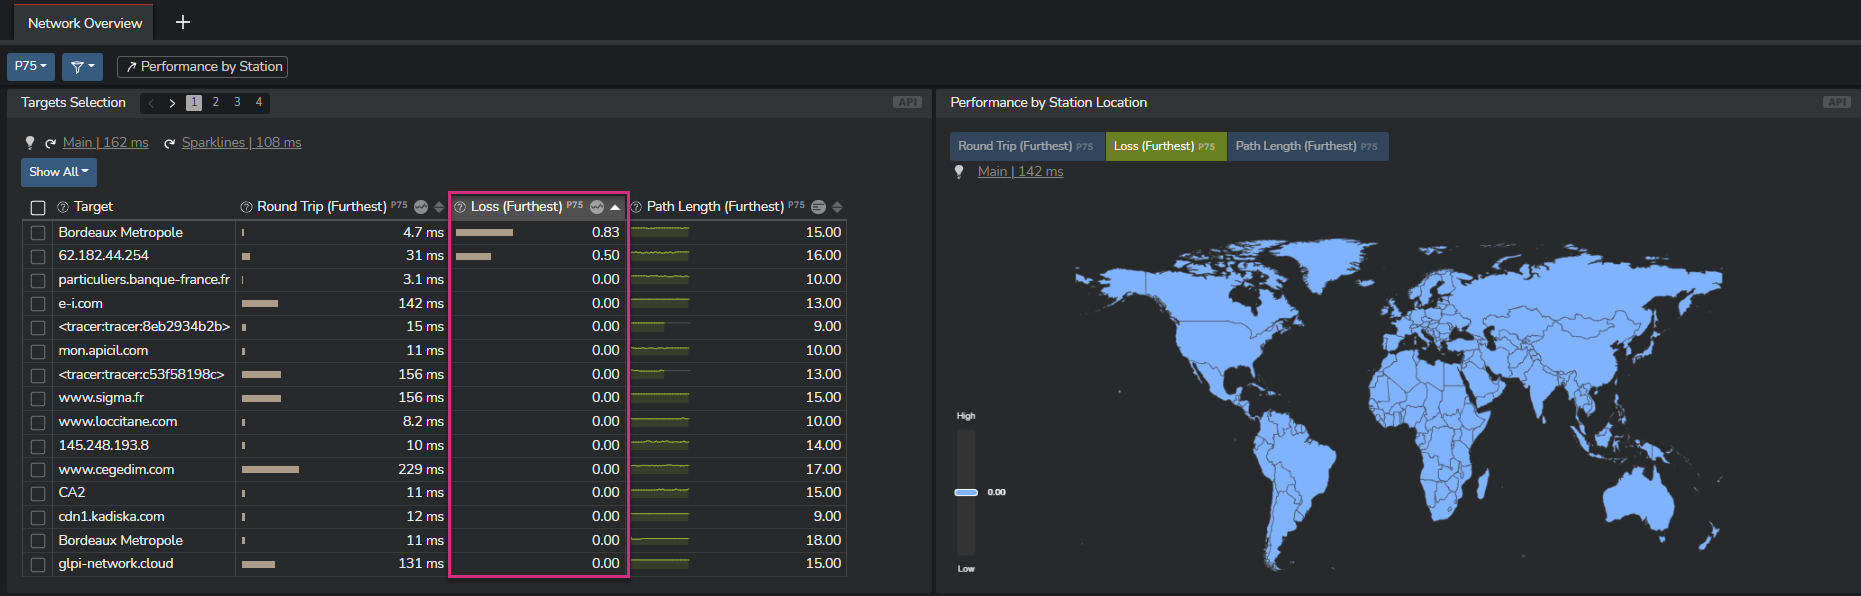
In the Kadiska platform, the end-to-end packet loss value is provided in different sections. First, in the "Network Overview" section, packet loss is provided by Net-Tracer target. If you do not use any filter, this packet loss value for a Net-Tracer target corresponds to a P75 (75th percentile) distribution of all packet loss values for all Kadiska Stations probing this target.
The map represents the packet loss value grouped by Kadiska Stations and countries. Again, the packet loss values correspond to a P75 distribution.
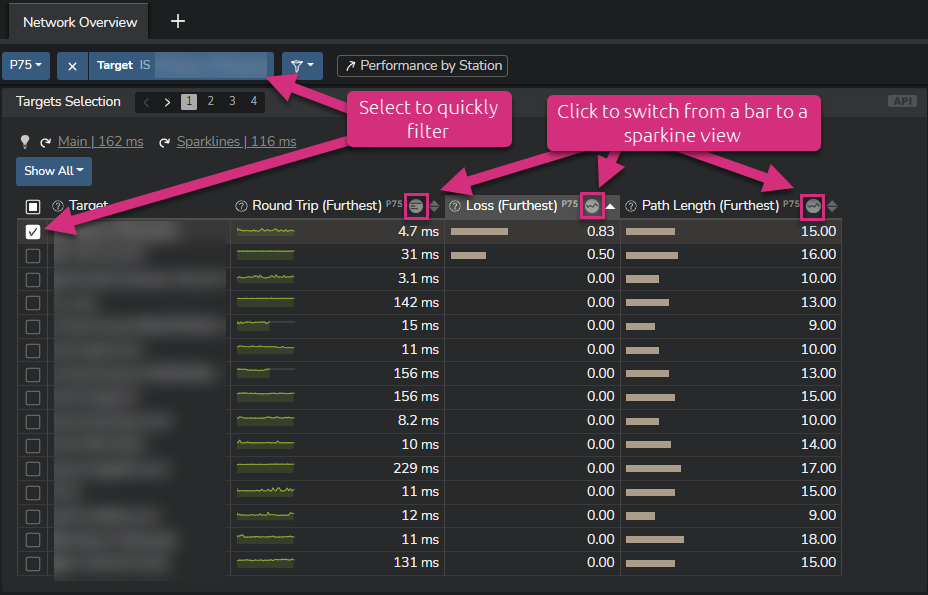
Quick tips (see picture below):
- For each metric, you can easily switch from a bar to a timeseries representation
- You can select any Kadiska Net-Tracer target to further filter on it(them)
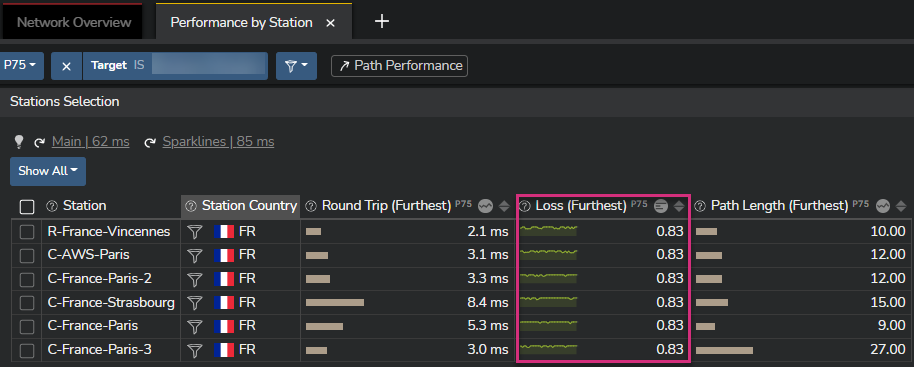
Moving to the "Performance by Station" next section keeps the filter you previously defined. This view provides the packet loss value per Kadiska Station.
Quick tip:
- Click on any column name to sort by the corresponding values (ascending or descending):
Finally, the end-to-end packet loss value is provided in the "Path Performance" section as a timeseries graph:
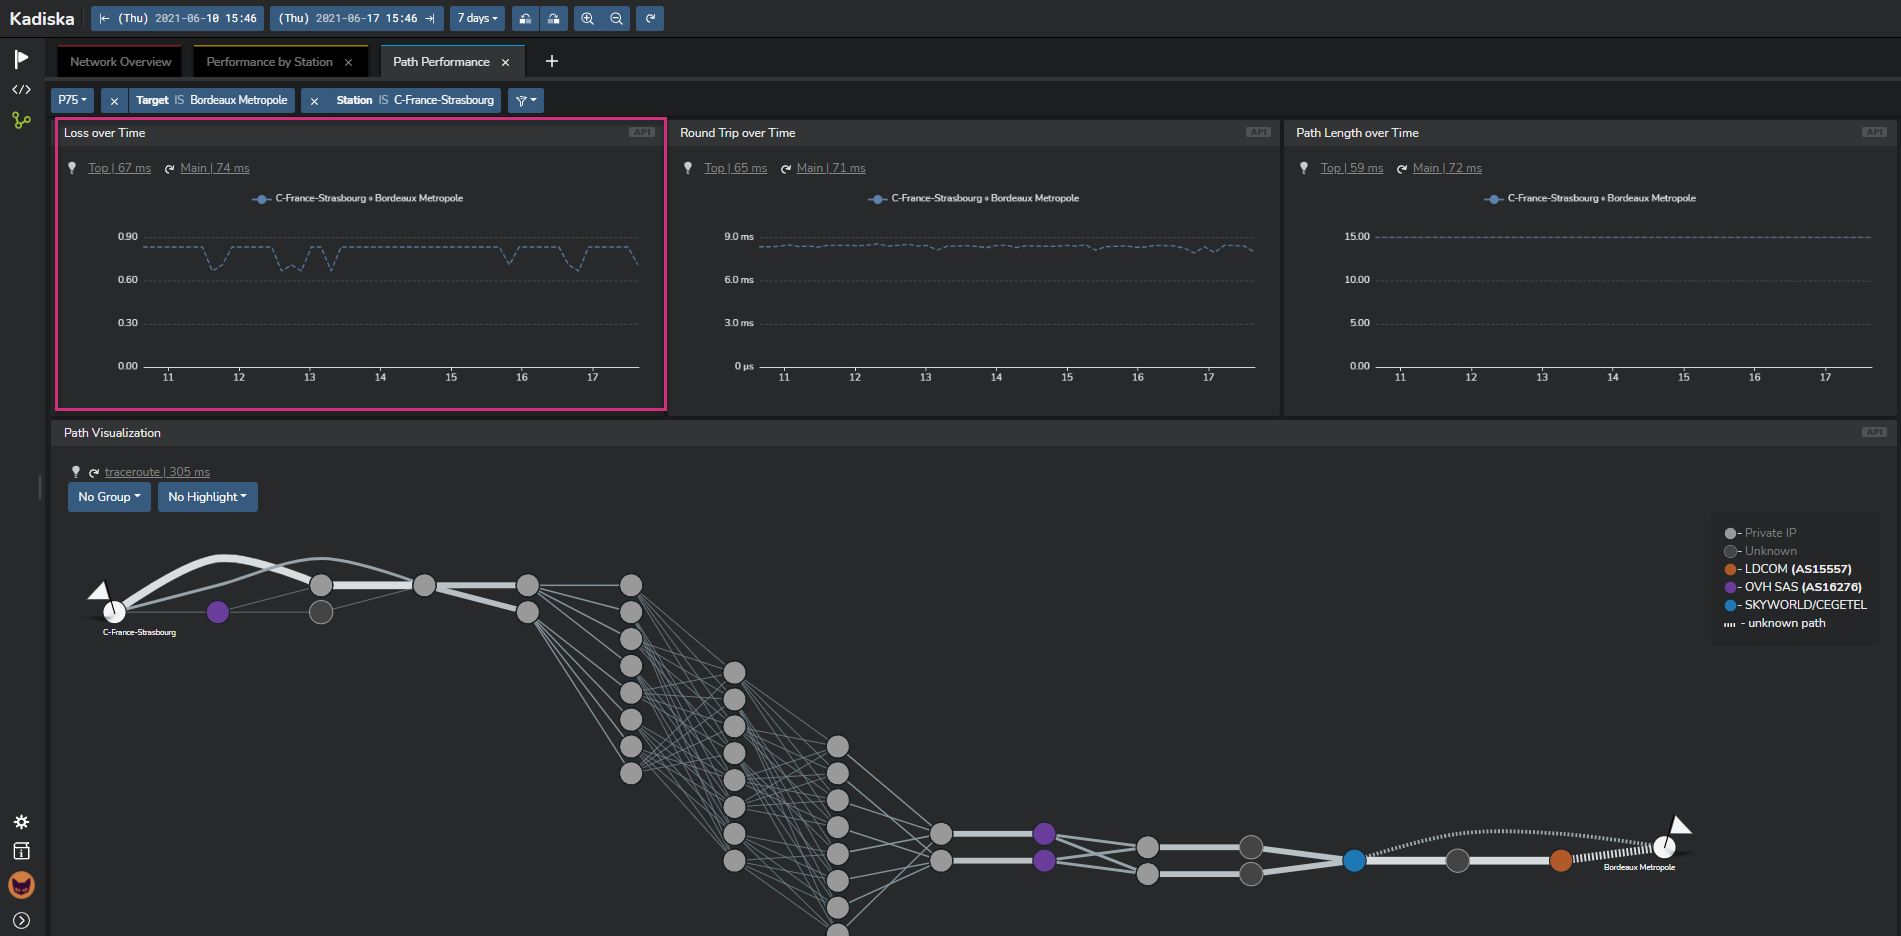
Note: The dotted lines in the timeseries means that the Net-Tracer method used did not reach the target.