Architecture overview
Main components
The Kadiska solution is a SaaS-based DEM (Digital Experience Monitoring) platform that is composed of three main components:
- The Platform
- The Watcher
- The Tracer
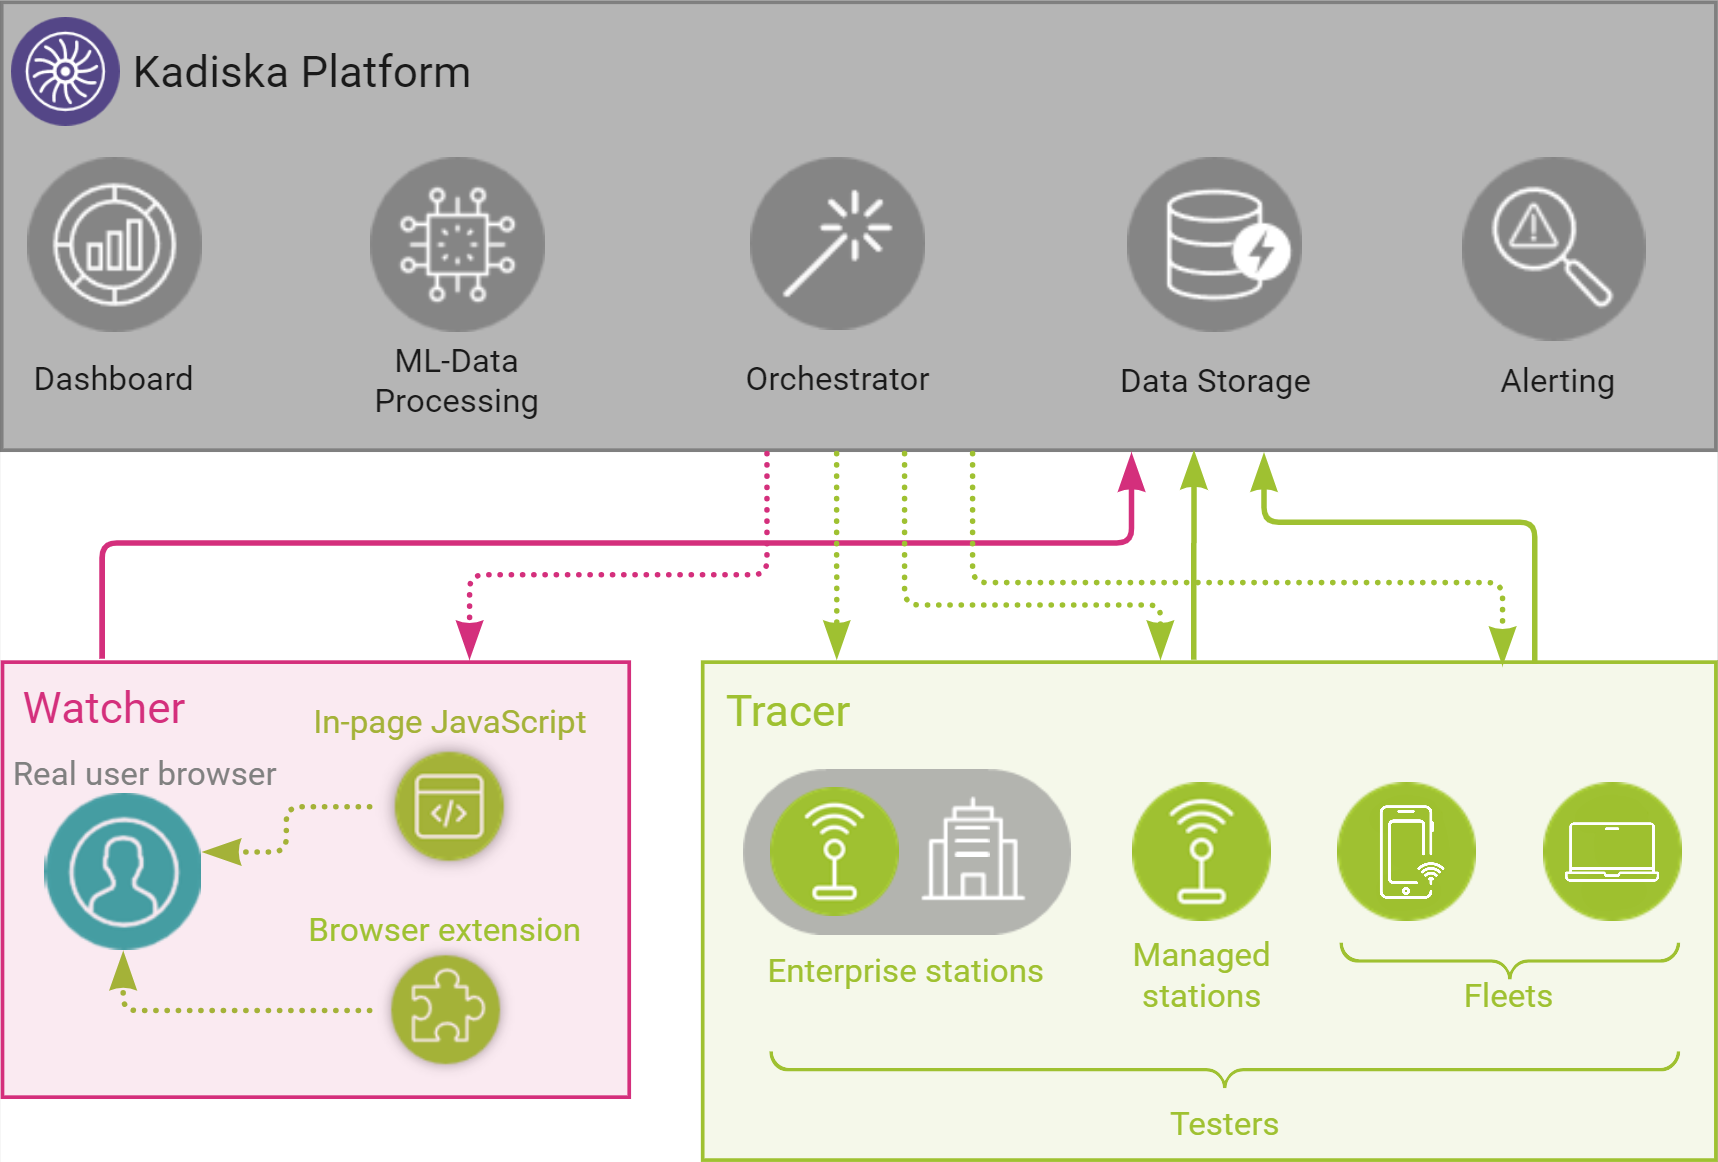
The Platform
The Kadiska Platform consists of a series of components that enable you to fully configure and monitor your environment from a unique user interface. It is accessible at https://app.kadiska.com. See here how to get access to it.
The Watcher
The Kadiska Watcher monitors real users activities by collecting metrics from their web browsers. This is achieved through either the use of a specialized in-page JavaScript or a browser extension. They instruct the browser to send performance traces to the Kadiska Platform.
The Tracer
The Kadiska Tracer consists of a series of synthetic tests that are launched from Kadiska Testers.
You can make use of the provided global network of Managed Stations or deploy your own Enterprise Stations and/or Fleets.
Today, Kadiska offers the Net-Tracer and HTTP-Tracer.
Deployment model
The way a typical Kadiska total monitoring solution works is schematized hereunder:
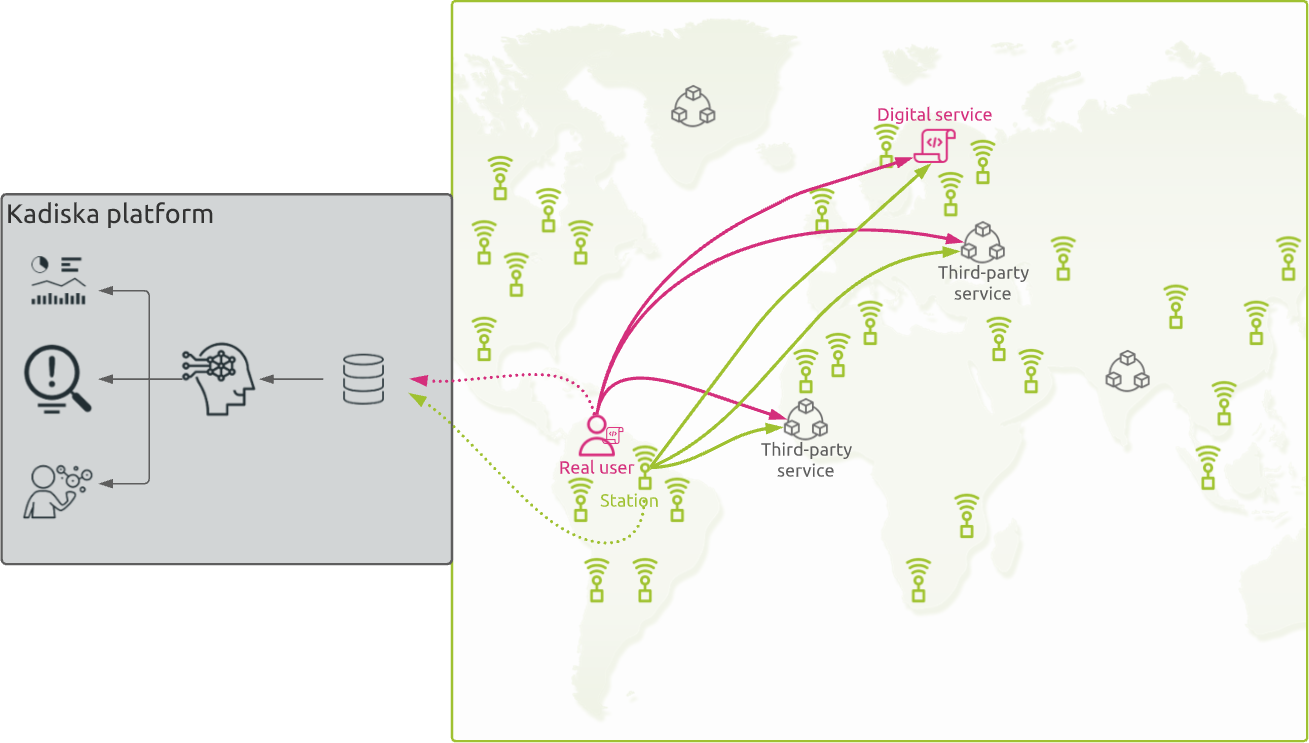
First, configure a Kadiska Watcher that corresponds to the digital service to monitor. In an internal web service scenario, you will probably use the in-app JavaScript to collect performance metrics from the users' browsers. In a SaaS monitoring scenario though, you would use the browser extension instead. Optionally, you can configure multiple Tracers to actively test this digital service, by using Managed Stations, your own Enterprise Stations and/or your own Fleets.
Once this is done, when a user connects to this digital service, the browser automatically downloads the Kadiska in-app JavaScript from the Kadiska CDN (Content Delivery Network) infrastructure or activate the browser extension according to the configured Watcher method. It enables the browser to collect performance and usage metrics that are then sent to the Kadiska Platform. These metrics are not only related to connections to the digital service itself, but also to any call to third-party services providers, like DNS and CDN. At this stage, the Kadiska embedded Machine Learning analyses the data and triggers the alerting system in case of any significant abnormal behavior or deviation from the baselines. When degradations occur, additional Tracers can be automatically activated to perform additional tests to all parties involved in delivering the digital service. These tests are performed by Testers that are the closest to the users that are experiencing the degradations.