News: September 2020
Experience metrics which are getting closer to the actual user experience
On top of the initial technical metrics (or “browser oriented metrics”), we have added some genuine user experience metrics, in accordance with Google Web Dev’s recent recommendations:
- Largest Contentful Paint or “Loading speed”: This is the time needed for the largest visual element of the page within the user’s viewport (this complements two weaknesses of Page Load Time: PLT does not take in account the time needed for the browser to process the paint on one hand and on the other hand it takes in account elements outside of the user’s viewport)
- First Input Delay or “interactivity”: it measures the time between a user action and the reaction being processed by the browser
- Cumulative Layout Shift or “visual stability”: it measures the impact of changes in the display marking content unstable visually. Each of these metrics is complemented with a target indicating the desired level for your application to match Web Dev’s recommendations.

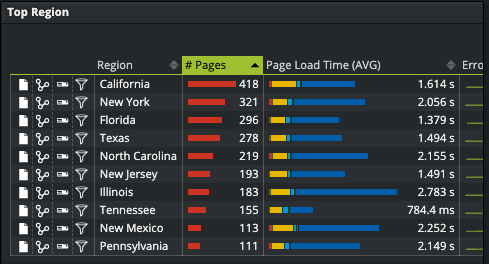
More granular geography
It is now possible to visualize the performance of your users at the state/region and city levels.
New diagnostic workflows
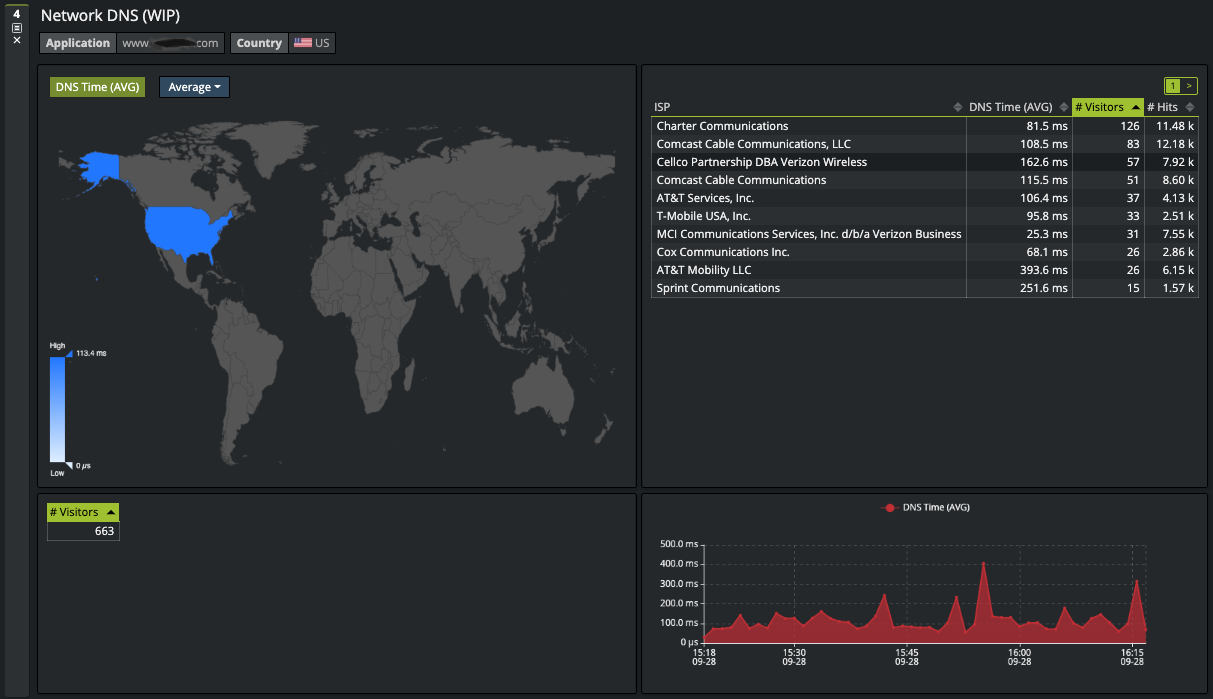
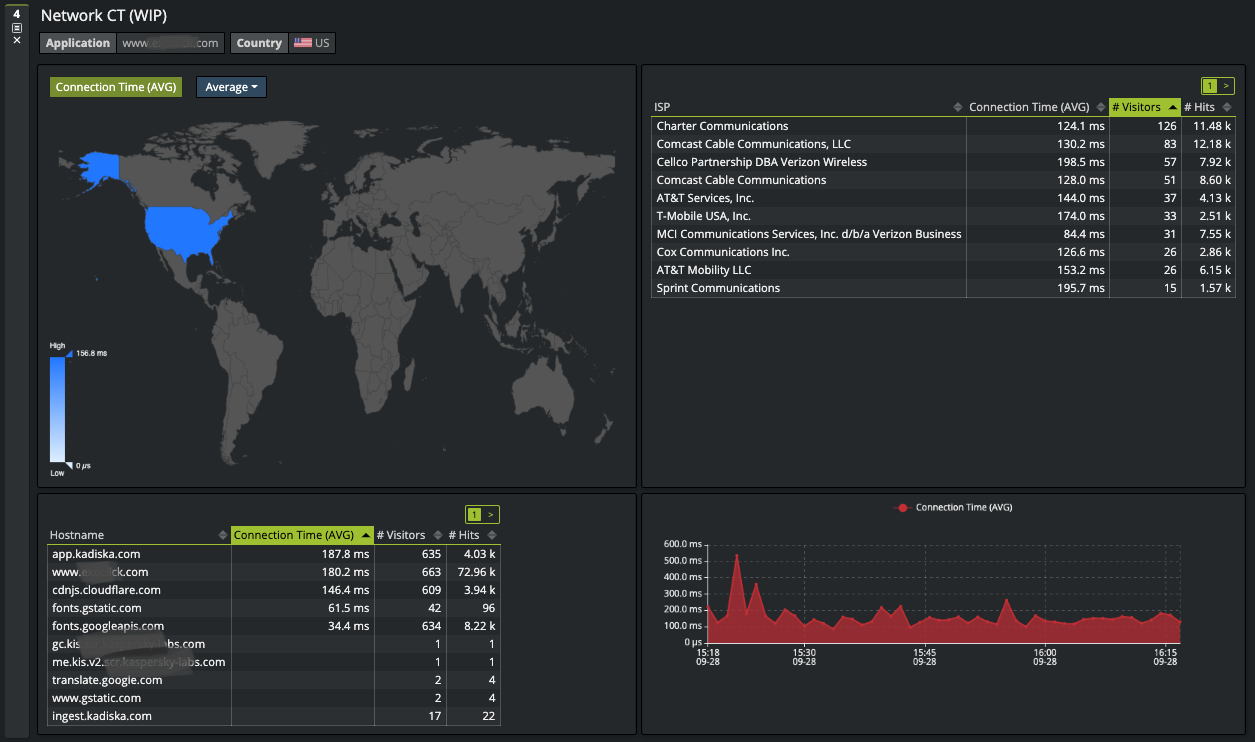
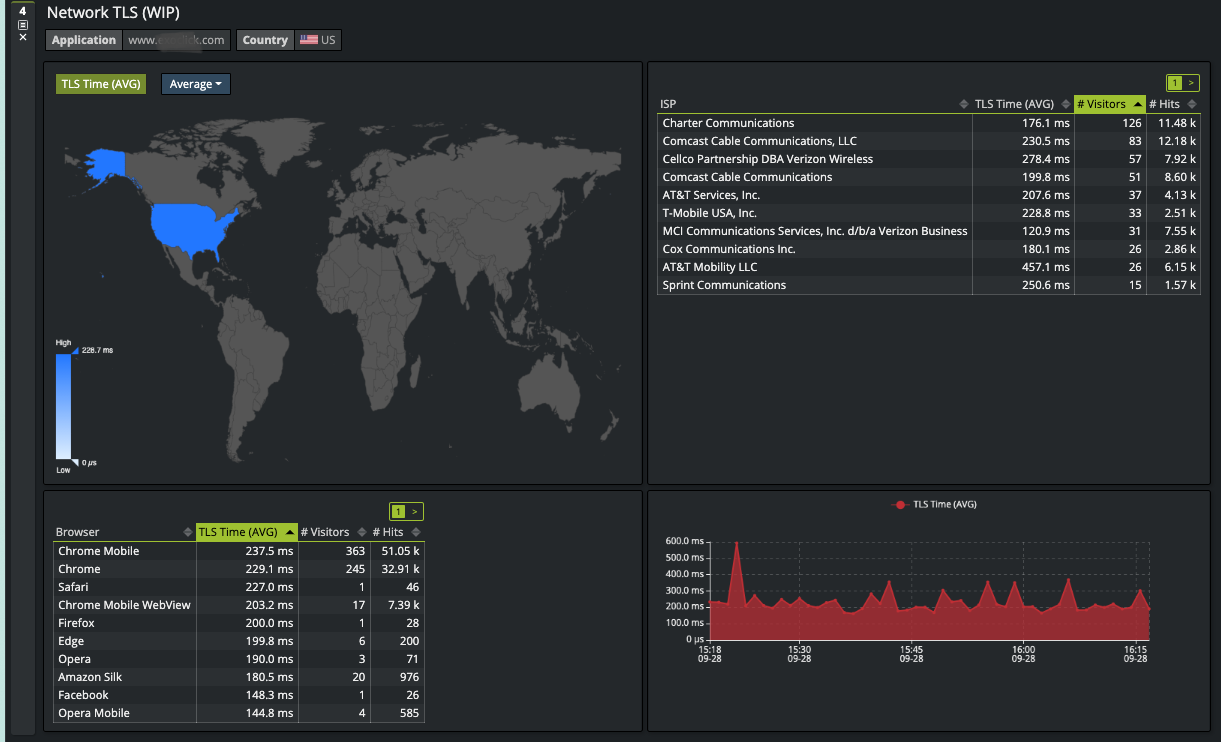
In addition to diagnostic workflow dedicated to page loading, Kadiska has added specialized workflows to troubleshoot network and server related issues. The network diagnostic provides insights on the DNS, network and TLS services and how they affect user experience in accordance with the time, geographic position of users and the operator used:
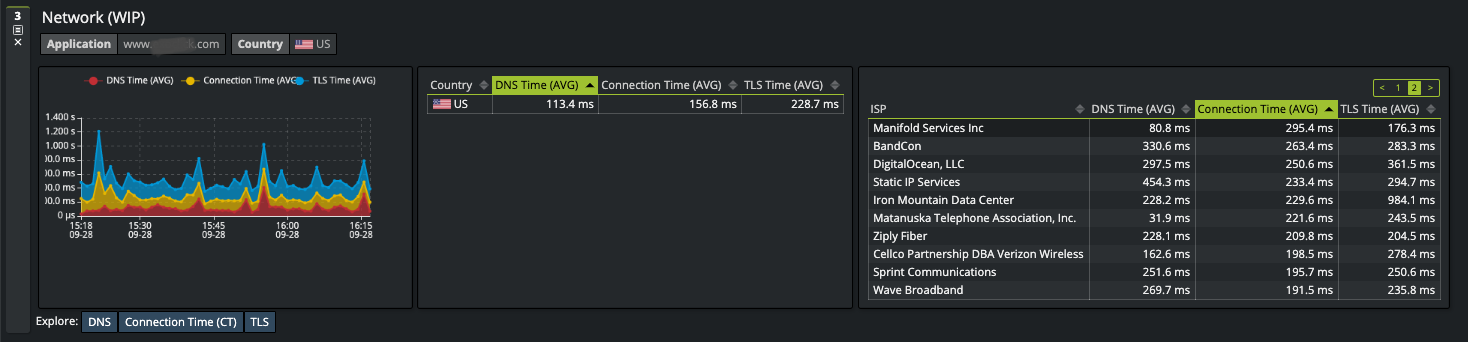
This first screen allows us to identify which part of the client-side infrastructure is causing the issue (DNS, network and TLS session establishment), where the impacted users are and which operators they are using to connect to the Internet. We can then drill down for further details on each of the infrastructure services, here DNS:
Network:
Or the secured session establishment:
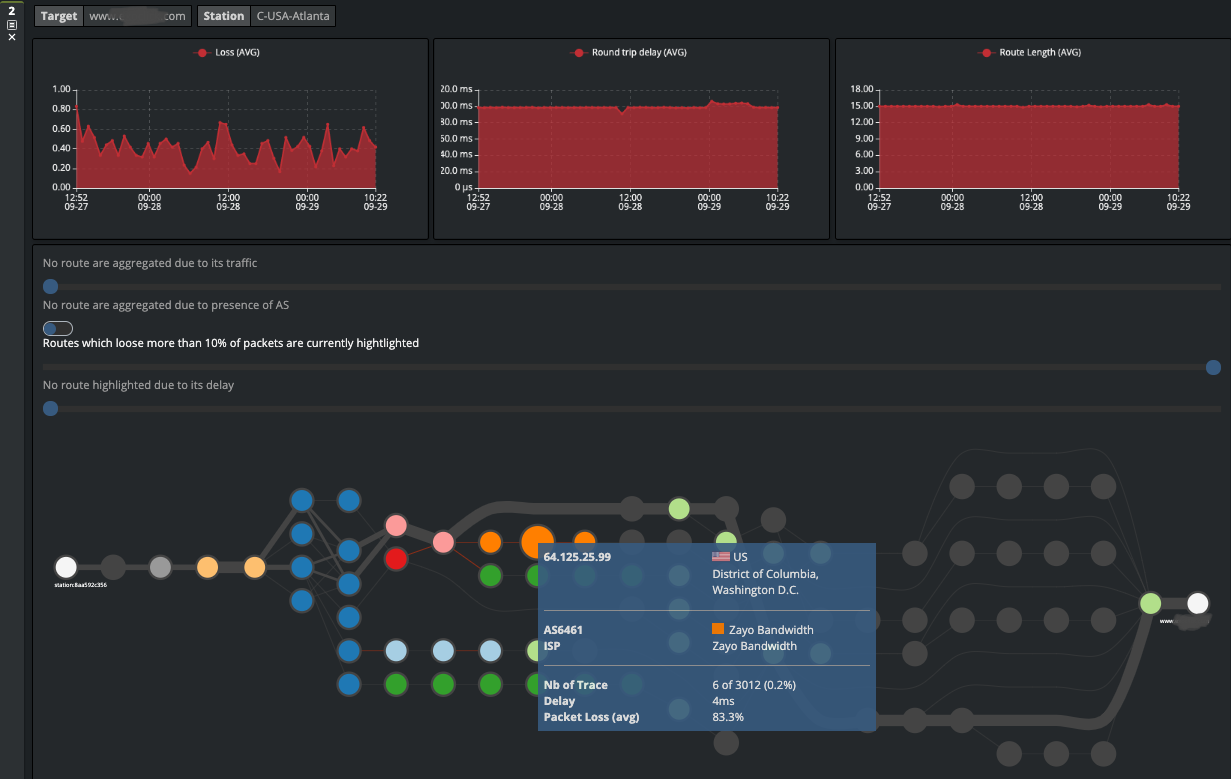
We have also improved the network path monitoring of Kadiska with a dashboard on the Internet reachability of your resources:
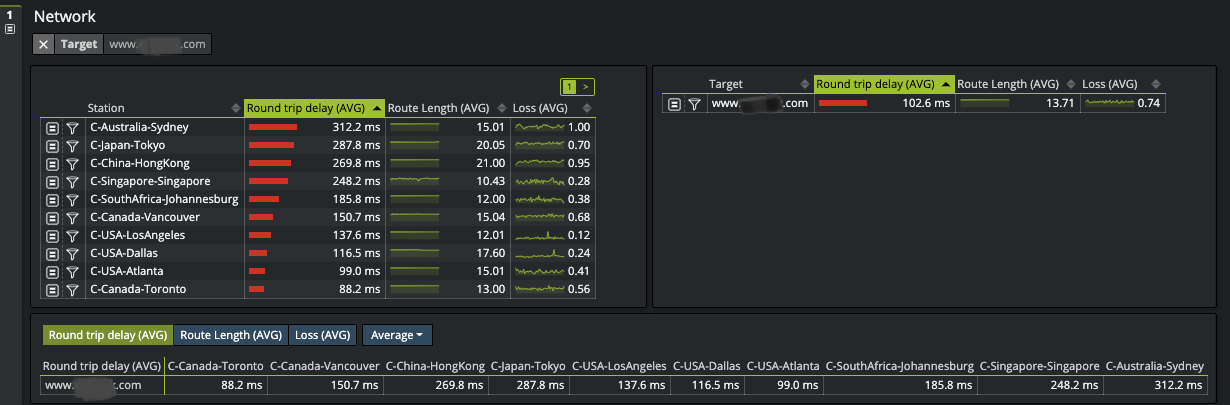
And the possibility to highlight the routes / paths where packet loss and excessive latency can be observed: