Release Note: September 2023
New "Users" dashboard
When troubleshooting performance issues, a common question that arises is "who is impacted?" In the past, the list of users was provided in the "Applications" dashboard, which may not have been very intuitive.
To address this, we have created a new "Users" dashboard that specifically focuses on identifying potentially impacted users and their corresponding connectivity context.
The new recommended navigation process is as follows:
- Start from the home page to identify any application degradation using the Apdex score.
- To understand the overall user context, including how they access the degraded application, and to determine if specific user groups or locations are being impacted, navigate to the "Applications" dashboard.
- For identifying specific users and their related precise context, go to the "Users" dashboard.
- To analyze a specific user journey, navigate to the "User focus" dashboard.
- If the application is an SPA and you want to troubleshoot application transactions, navigate to "API calls scope analysis" dashboard.
- If the application is an MPA and you want to troubleshoot application transactions, navigate to the "Scope Analysis Pages" dashboard.
New "Unassigned Traffic" page in Sites configuration
Sites and gateways configurations apply to both Watcher and Tracer technologies.
To accurately geolocate users and testers, a proper mapping between sites and gateways is necessary.
Without it, the location of testers (Tracer) cannot be determined accurately, and users (Watcher) are considered remote.
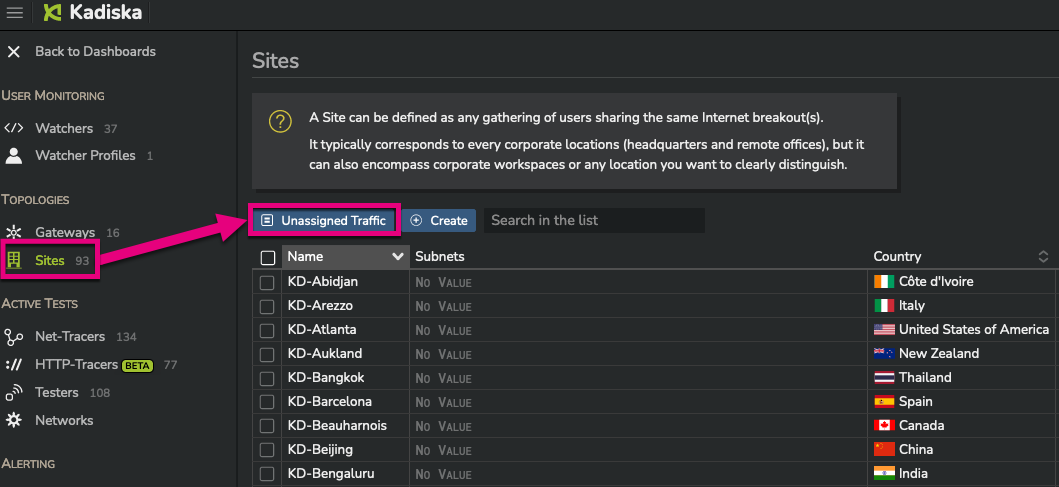
A new "Unassigned Traffic" page is now available from the "Site" configuration view:

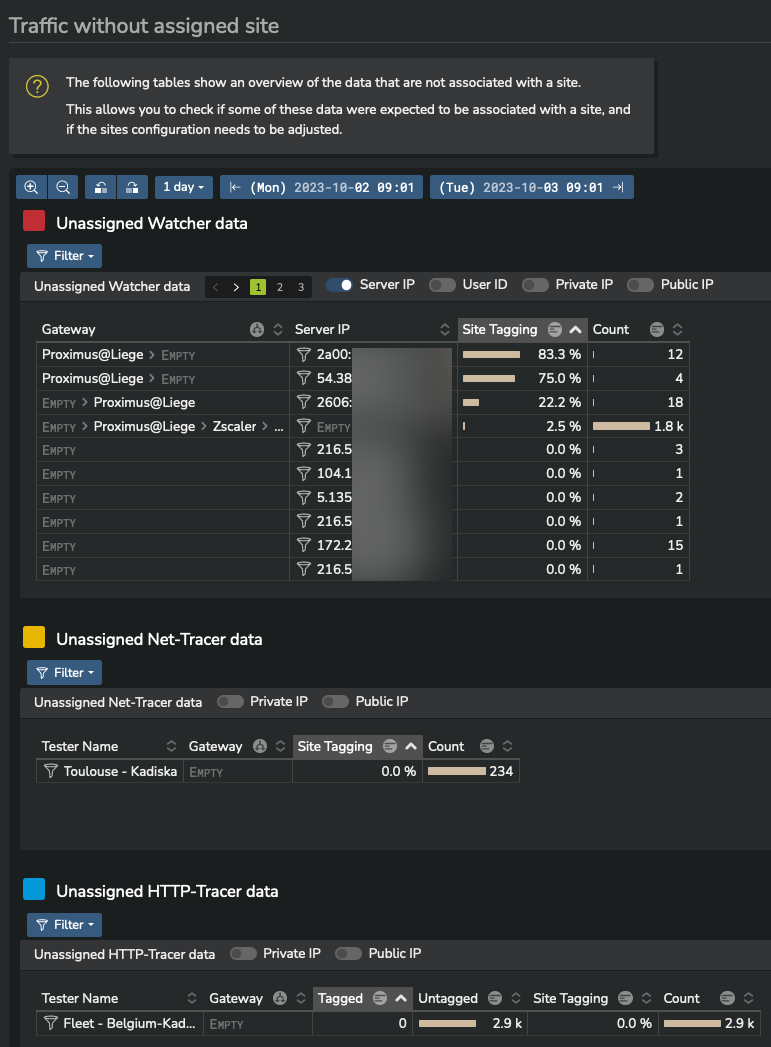
This page displays all traffic that corresponds to an unknown site/gateway mapping and provides the associated private and public IP addresses.
This feature will assist you in fine-tuning your sites and gateways configuration.

Navigation context preservation
Previously, when you navigated from the Watcher universe to the Tracer universe, or vice versa, or when you returned from a configuration view to either a Watcher or Tracer view, you would lose the context you were in.
This is no longer the case. Kadiska now keeps the context in memory, allowing you to navigate between universes or access the configuration menu and return later without losing the filters you had previously defined.
New dashboard "Reset" button
When analyzing data, you may navigate between dashboards and define filters based on your context.
Once you have completed your analysis, you may want to start a new analysis from scratch.
This means that you are no longer interested in preserving the history of all dashboard views.
To facilitate this, we have introduced a new "Reset the dashboards" button.

When you click on this button, all existing dashboard views are automatically closed, all filters are reset, and you start from the "Overview" dashboard of the universe you were in.