Apdex
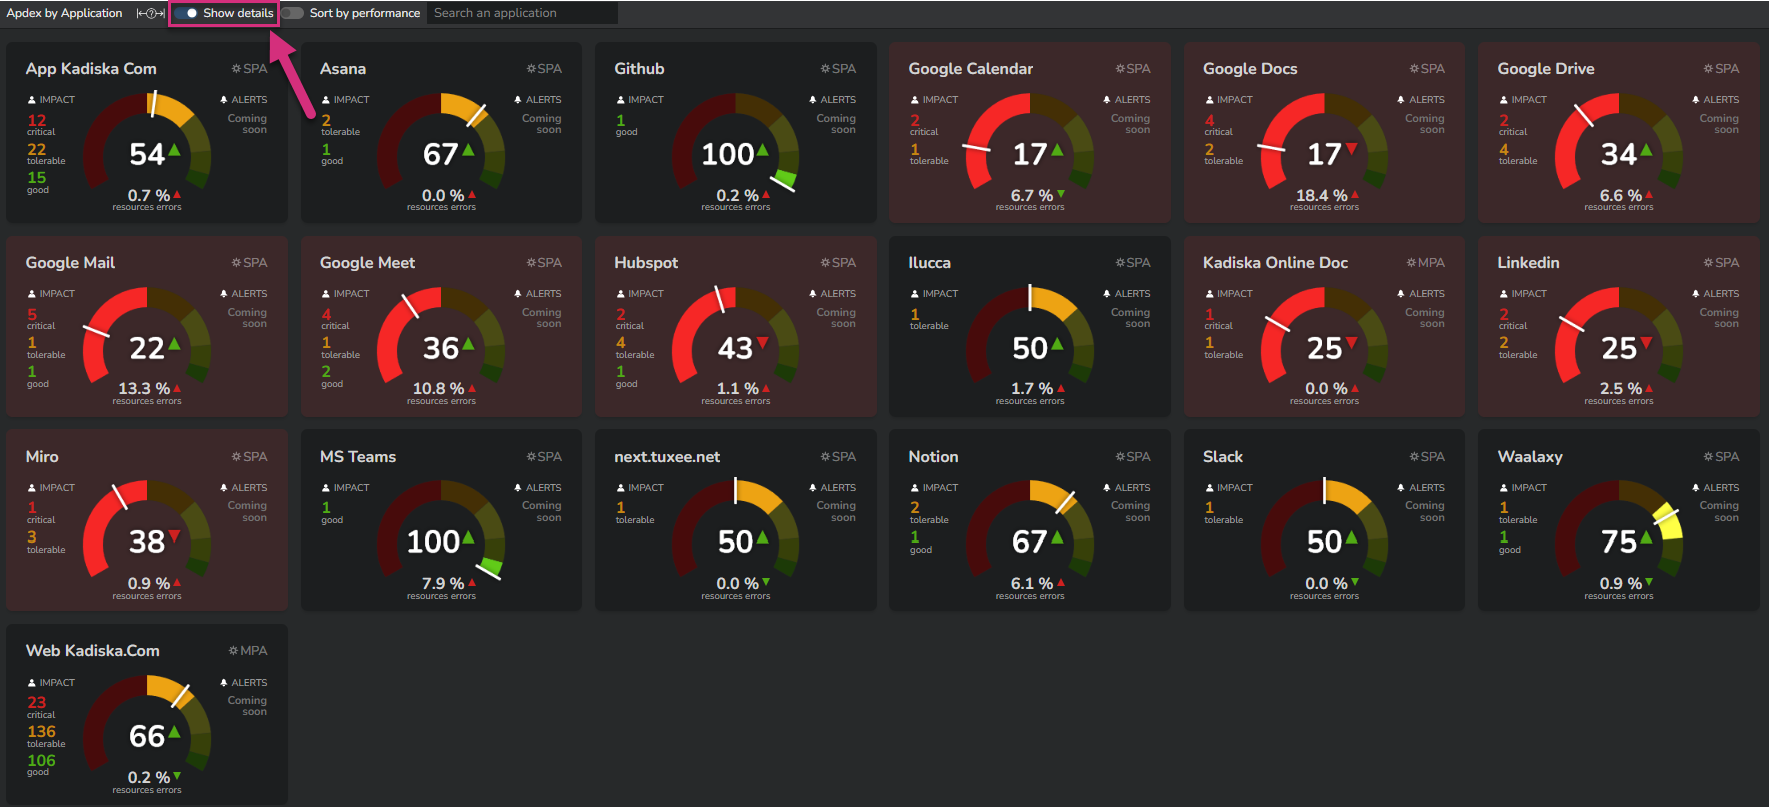
The Kadiska platform's home page provides an overview of each monitored application's performance score.
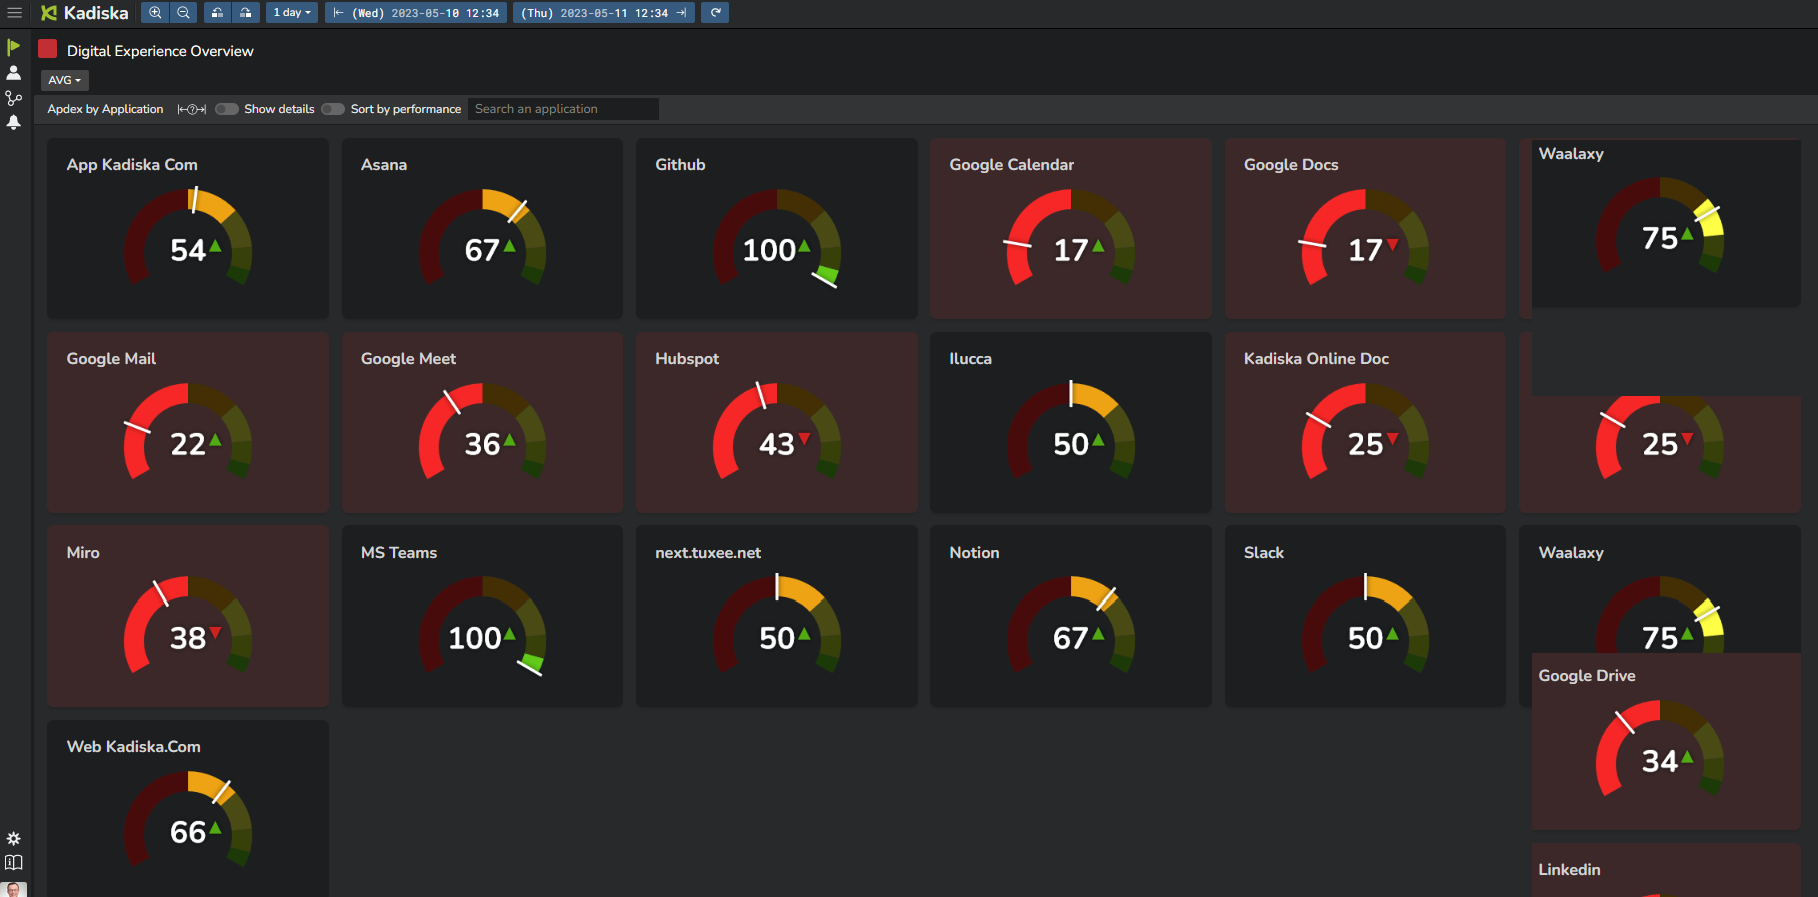
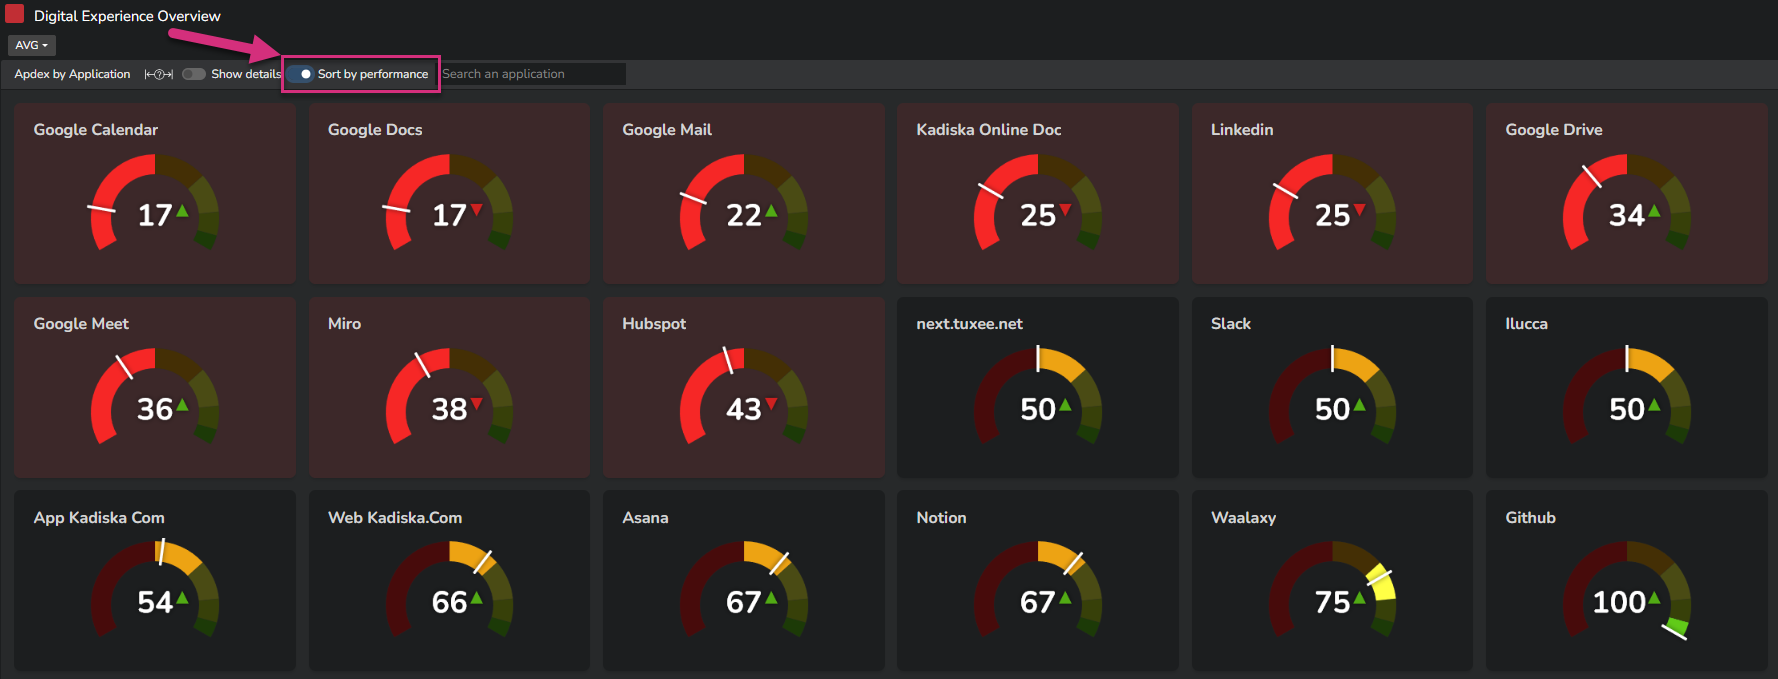
Applications are sorted alphabetically by default, but you can sort them by performance level if you want to see the most degraded applications first.
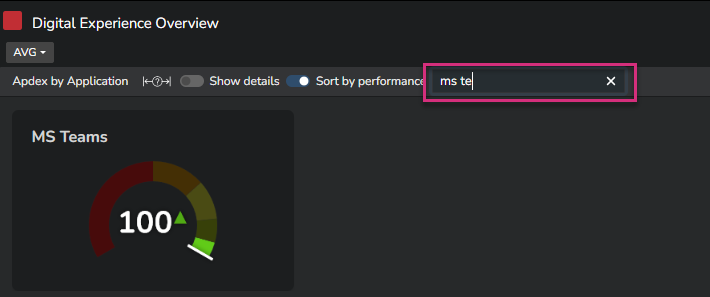
When you have many applications, you may want to filter them for more clarity and focus. Use the "Search" bar to do so.
If you want to see more details on each application's performance card, simply select the "Show details" option or mouse over any card to get corresponding details:
Apdex calculation
The application performance score is based on the Apdex (Application Performance Index) open standard, which represents user satisfaction with the performance of applications. The Apdex score is a number between 0 and 1 (0 = no users satisfied, 1 = all users satisfied), which is represented in the Kadiska platform as a value between 0 and 100.
The Apdex calculation is based on a performance target value as well as three levels of user satisfaction:
| User satisfaction level | measures compared to performance target |
|---|---|
| Good | measures < performance target |
| Tolerable | performance target < measures < 4 x performance target |
| Critical | measures > 4 x performance target |
The Apdex value is calculated as the percentage of satisfied users plus half of the percentage of users with a tolerable experience.
So, taking all users and corresponding performance measurements into account (for the selected time frame), the Apdex score is calculated as follows:
Apdex = (#Good + 0.5 x #Tolerable) / #measures
where #Good and #Tolerable are respectively the number of users for whom the user satisfaction level is good and tolerable.
The performance metric to take into account for this Apdex calculation is automatically defined by Kadiska based on the application nature identification.
An application can be a Single Page Application (SPA) or a Multi Page Application (MPA).
An SPA's performance is mainly driven by API calls performance, while an MPA's performance is mainly driven by web pages loading speed, so the corresponding measured performance metrics are:
| Application type | Kadiska performance metric |
|---|---|
| MPA | Loading |
| SPA | API Calls Processing |
For more details about SPAs and MPAs, please refer to the following blog articles:
Kadiska automatically identifies an application's nature based on its behavior.
You can see the application type at the top right corner of each application card.
Click on it to get more details.
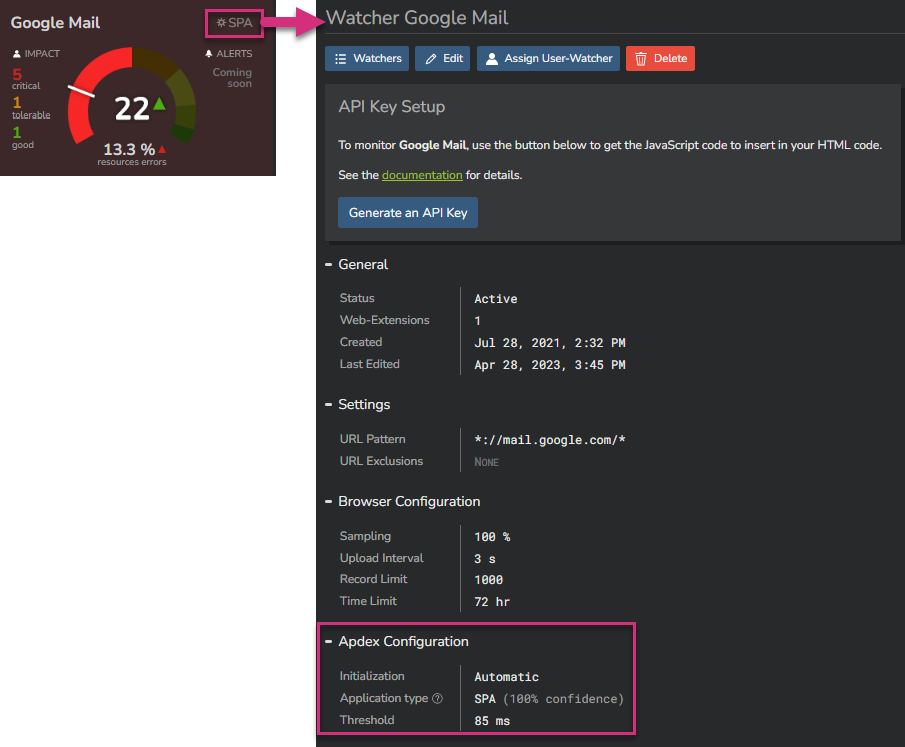
The Apdex Configuration section provides the level of confidence for the Kadiska application's nature recognition process, as well as the performance target. This target is automatically determined based on historical data.
In the example above, the confidence level is 100% and the performance target is 85ms.
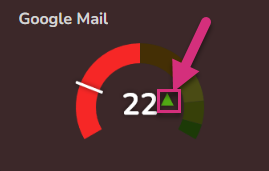
Trending
The sign to the right of the Apdex value indicates whether the application's performance is currently degrading, improving, or remaining stable over time.
Scope of the degradation
When the performance of an application is degraded, it is important to quickly identify the scope of this degradation. The scope will be one of the main factors driving troubleshooting priorities.
This information is provided by the number of users that fall into the different Apdex categories.
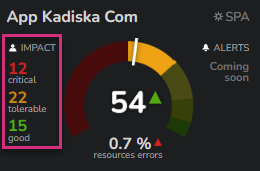
On the above screenshot, 15 users do not experience any problem, 22 users experience a tolerable performance, and 12 are experiencing degradations.
The 15 users represent ~31% of the total number of users, while 22 users represent ~45%.
So the Apdex score is calculated as follows: 31 + 45/2 = 54 (rounded up).
Troubleshooting performance
From the Apdex
If you want to troubleshoot application performance issues, it's important to understand the user's context. To do this, click on the "IMPACT" section of the application performance card. This will automatically redirect you to the "Applications" dashboard, which is focused on the application you are analyzing.
If you also want to troubleshoot the application itself directly, click on the Apdex score. This will redirect you to either:
- the "API Calls Scope Analysis" dashboard for an SPA, or
- the "Scope Analysis Pages" dashboard for an MPA.
From the errors rate
Failed transactions can impact application performance. Kadiska provides this information as a separate performance metric in each application performance card.
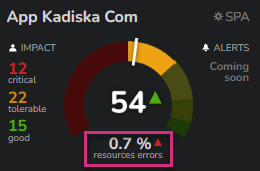
This value represents the percentage of resource-related transactions that failed during the selected time frame.
Additionally, the trend is also displayed.
Clicking on this value will redirect you to the "Resources" dashboard, which is focused on this application and its errors. Here, you can see when errors occur and which services/resources are affected.
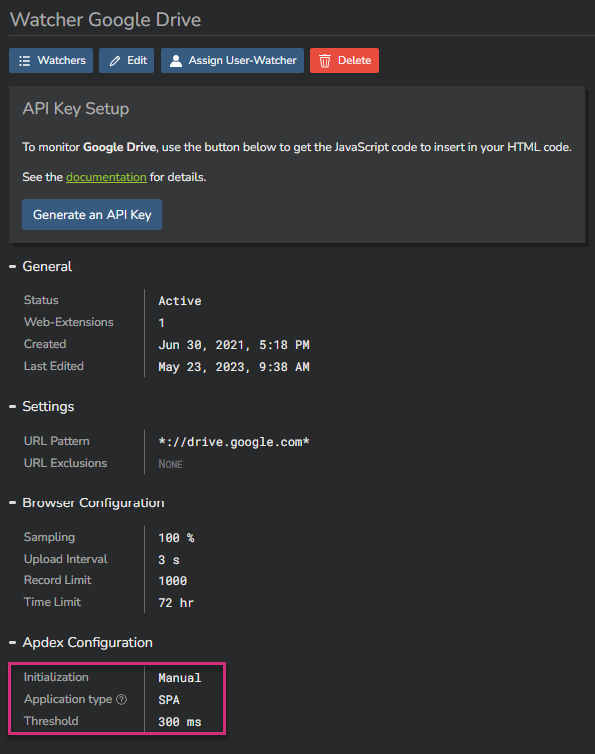
Apdex settings
As stated previously, the Apdex score is based on two factors:
- The nature of the application (SPA vs MPA)
- The performance target value
By default, everything is automatic. Kadiska identifies the nature of the application based on the number of pages and API calls, and calculates the performance target value accordingly, based on historical collected data.
If you are not satisfied with the result of this automated process, you can apply your own settings by going to the corresponding Watcher configuration menu.
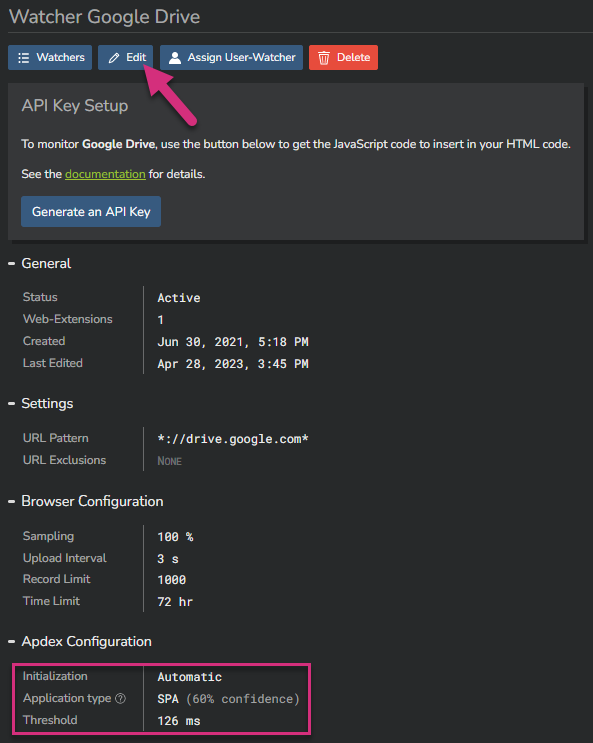
On the screenshot above, the application has been identified as an SPA, with a performance target value of 126ms. You can modify these settings by clicking on the "Edit" button.
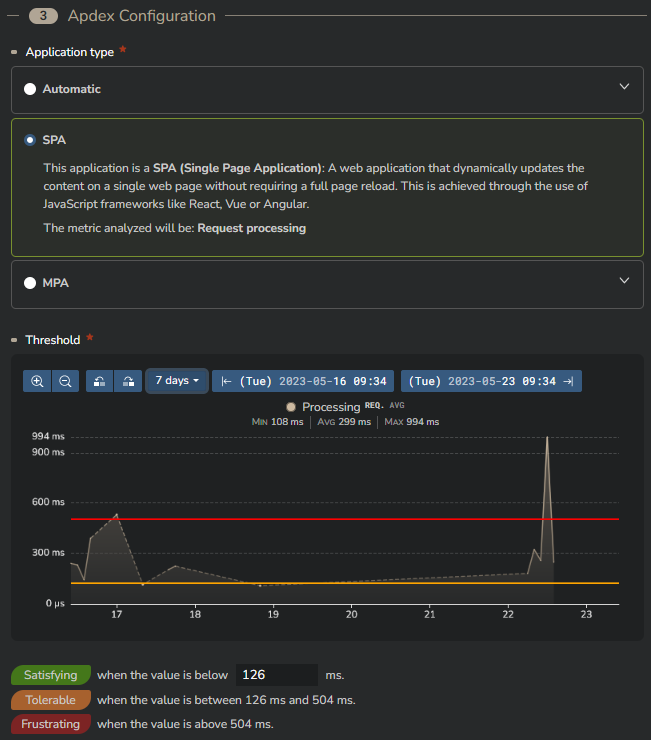
When you select the "SPA" option, Kadiska provides the evolution over time of the "API calls processing" metric, so that you can more easily set up the performance target value accordingly.
On the other hand, selecting "MPA" would provide the evolution over time of the "Loading" performance metric.
Once you have finished configuring the settings, click on "Apply" to apply the changes.
You will then see that the configuration has switched to "Manual":