Main Concepts
The alerting system is an important component of the Kadiska platform as it enables you to proactively monitor your digital services performance without constantly keeping an eye on your dashboards.
The Kadiska platform lets you configure highly customizable alerts so that you can be instantaneously informed about any service degradation.
Alerts can be visualized in the Kadiska platform itself or can be exported in real time to any centralized alerting system you may be using within your organization.
Configuring an alert is a three steps process:
- Create the rule that will trigger the alert
- Create the notification channel(s) you want to use
- Create the policy(ies) that will link alerts to the preferred notification channel(s)
These steps are respectively performed through the definition of rules, webhooks and policies.
The "rules"
A Rule defines the circumstance under which an alert must be triggered.
You can use any metric available in both Kadiska Tracers and Watchers to trigger alerts.
Multiple alert thresholds can be configured to more proactively detect any degradation that directly impacts users or could end up impacting users in the future. Kadiska supports three threshold levels:
- Warning: typically used to notify a degradation that does not yet affect endusers experience or does not yet exceed a specific maximum value (SLA/SLO)
- Critical: typically used to notify a degradation that does affect endusers experience or does exceed a specific maximum allowed value (SLA/SLO)
- OK: used to notify the return to a normal state (end of the degradation, alert reset)
Alerts can be configured on specific items (like an application, a country, a device type, ...) by using filters. Multiple filters can be combined to align with your specific requirements.
Monitored groups
If you want to monitor multiple instances of a single metric, you can use the "split by" function.
For example, let's say you want to monitor the Loading performance of your digital service. But instead of getting an alert in case of a global degradation of this service, you want to be alerted if any specific users' origin country is being impacted.
Of course, you can create one alert rule per country. But a better and easier way consists of creating one global alert and use the "split by" country feature, so that you can monitor the Loading value for all countries at once!
The number of "Monitored Groups" corresponds to the number of distinctive instances of this metric. In the example above, if your digital service is reached by users located in 10 different countries, then 10 instances of the performance metric will be calculated so that alerts can be triggered for each country individually.
Alerting methods
The Kadiska platform will propose three different alerting methods according to your specific use case.
SLA/SLO Compliance
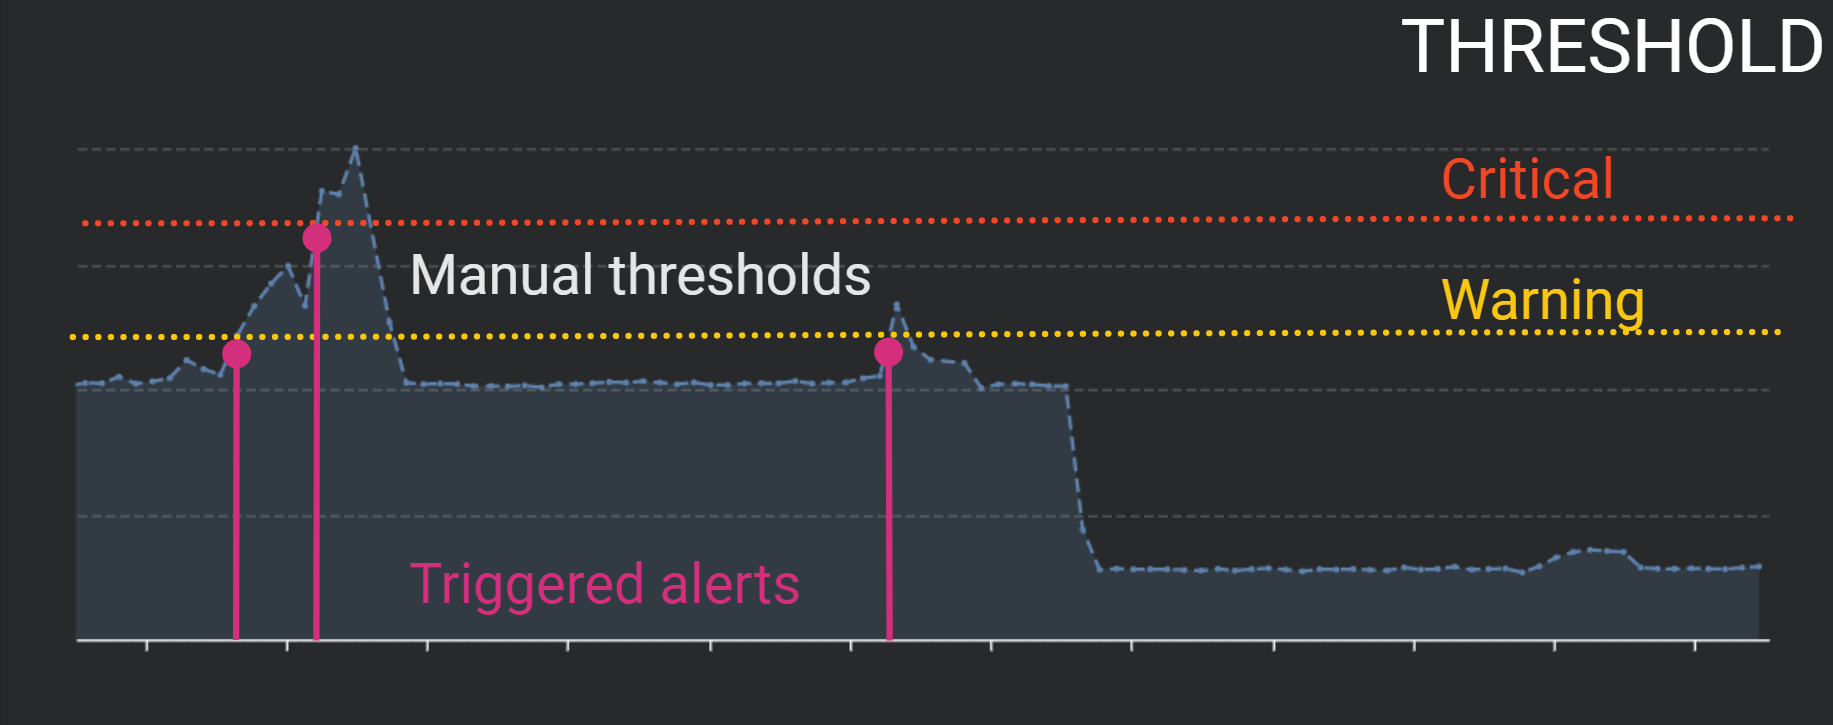
If you are interested in monitoring SLA/SLO compliance, we recommend using the "Threshold" method.
This method lets you manually configure specific metric values that will trigger the alerts.
In this scenario, an alert is being triggered when the measures exceed the configured thresholds.
Configuration options are available in order to avoid behaviors like "alert flipping".
See the configuration section for more details.
Anomaly Detection
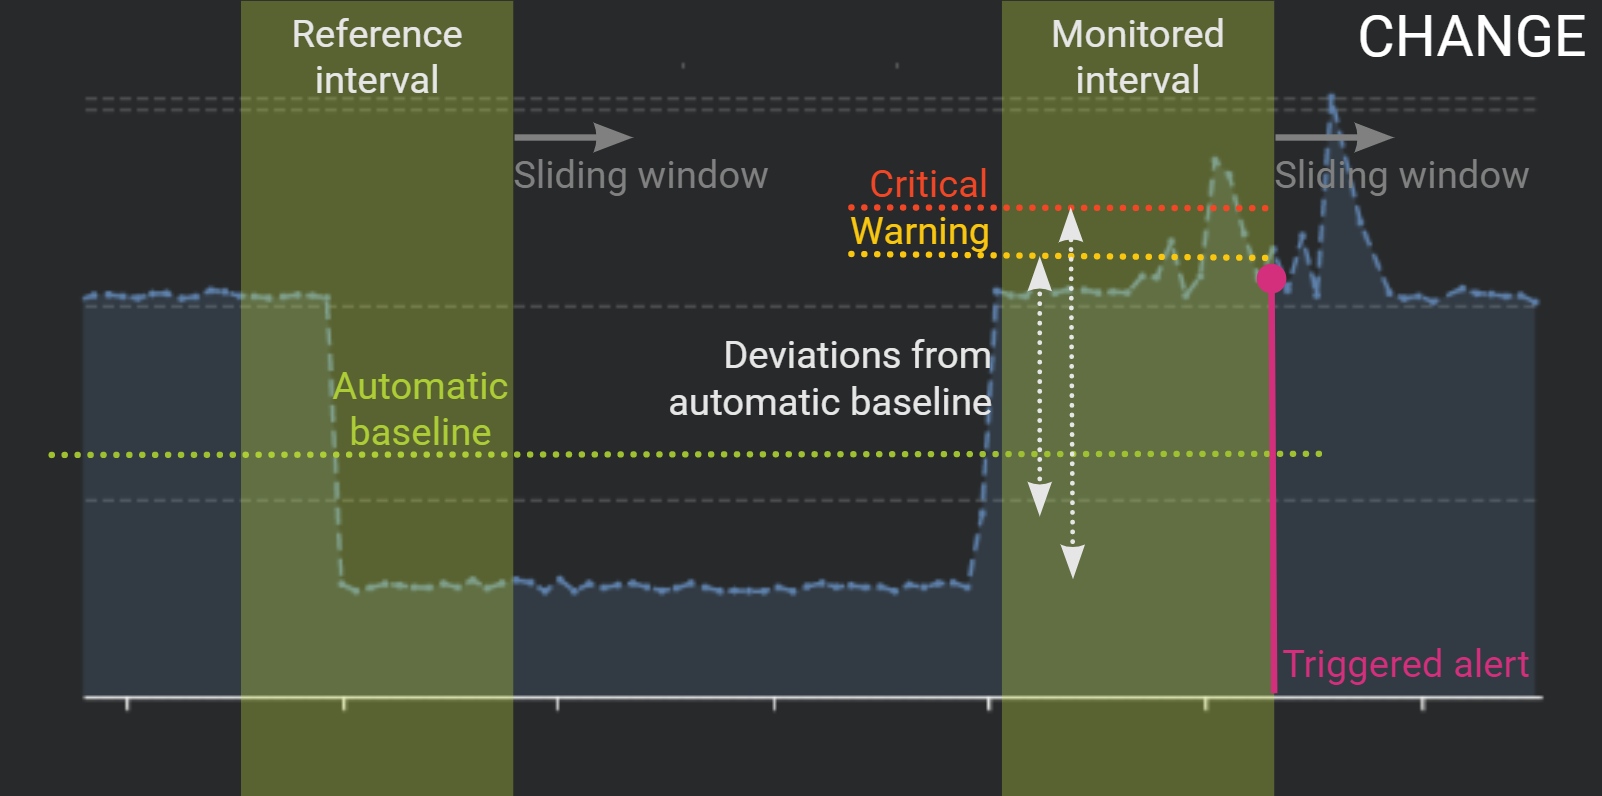
If you want to automatically detect sudden degradations, we recommend using the "Change" method.
In this scenario, the Kadiska platform automatically calculates the monitored item performance baseline so that you do not have to specify any alerting threshold manually.
Instead, you configure a deviation from this automatic baseline as well as two time intervals you want to compare the data between.
An alert is then triggered when the deviation between both intervals exceed the configured allowed values.
One alert is potentially triggered per time intervals comparison. Time intervals are regularly updated thanks to a pre-configured sliding window.
Trending Analysis
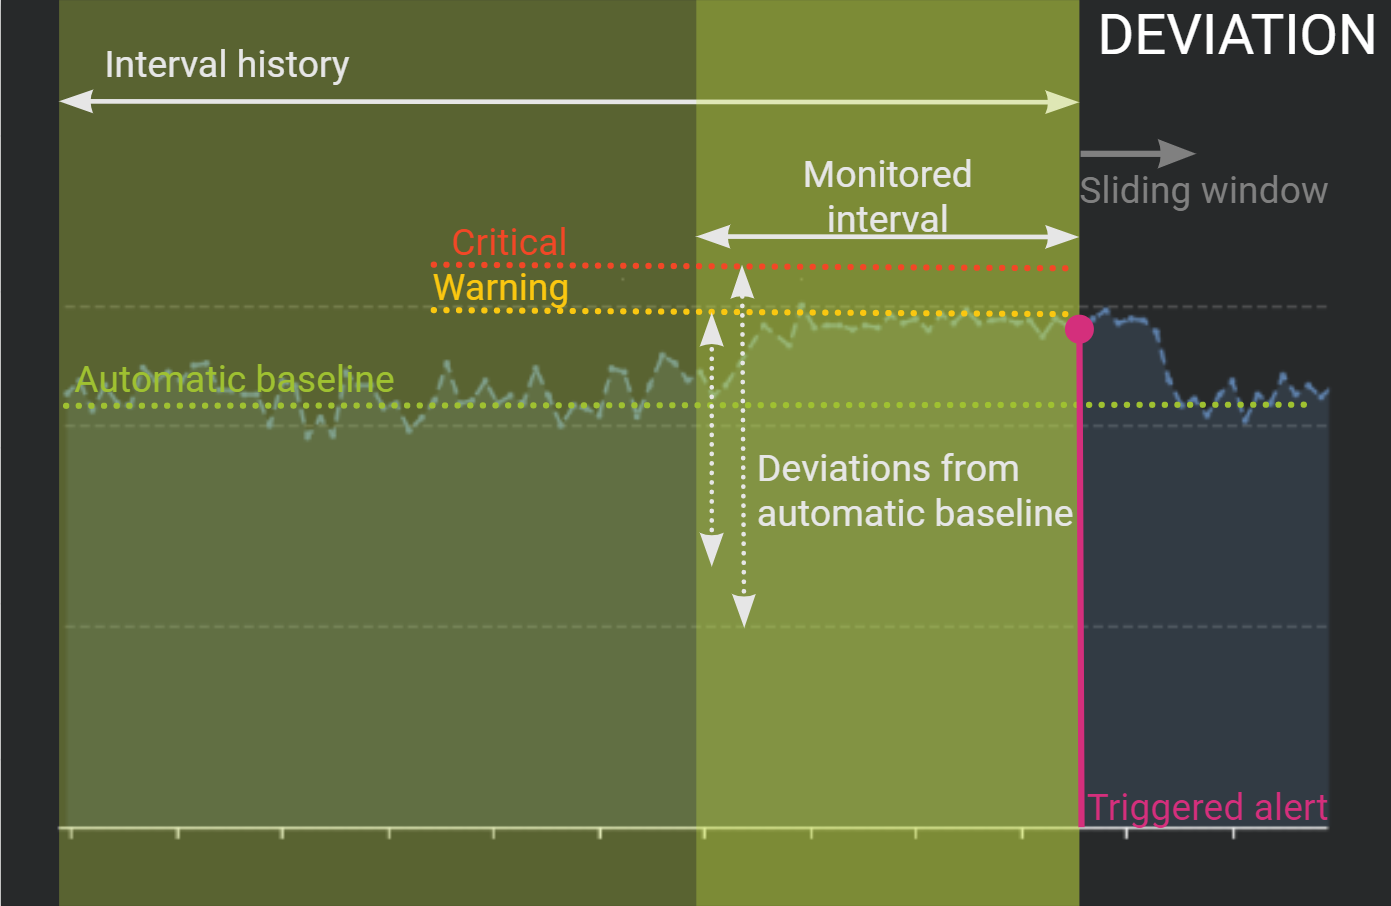
Finally, if you want to detect slow degradations, the "Deviation" method will best fit your needs.
Again, this method is based on a deviation from an automatic baseline, but instead of comparing two consecutive time intervals, you compare short-term data to a longer period.
An alert is then triggered when the deviation between both intervals exceed the configured allowed values. One alert is potentially triggered per time intervals comparison. Time intervals are regularly updated thanks to a pre-configured sliding window.
The following table summarizes the main use cases and corresponding alerting methods to favour:
| Use Case | Alerting method | Description |
|---|---|---|
| SLA/SLO Compliance | Threshold | Alerting on manual threshold settings |
| Anomaly Detection | Change | Detect any sudden abnormal behavior |
| Trending Analysis | Deviation | Detect slow degradations |
The "Webhooks"
Kadiska favours using Webhooks as main method to export real time alerts to external incident response platforms like PagerDuty or communication platforms like Slack.
A webhook defines the communication channel to use and specifies the content of the message to be sent in case of an alert.
Kadiska provides the flexibility you need to create custom notifications.
For example, you can create a global webhook that will trigger a message for all types of alert thresholds, or you can create specific webhooks according to the level of criticity of the alert you want to send.
Webhook is just a way to send real time alerts to third-party systems.
You can also make use of the Query API to export alerts.
The "Policies"
Once you have configured the alerting rules and have defined the notification channel(s), the last step consists of specifying which type of alerts will be sent through which notification channel(s).
A policy is the link between a rule, the corresponding thresholds level (Warning/Critical/OK) and the notification channel.
For example, for a specific alert, you may want to send all "warning" notifications to a Slack channel, while sending all "critical" notifications to your corporate incident management system.
A policy can be associated to multiple rules and multiple webhooks.