How to set up an Enterprise Station
Technical requirements
Hardware specifications
The “Enterprise Station” is a container-based software that allows you to perform different types of synthetic tests, called "Tracers".
The Kadiska Enterprise Station can run on any type of hardware and software platforms that comply with the following minimum specifications:
- CPU and operating system must use x86_64, ARMv7 or ARM64 architecture
- 2GB of RAM
- 1GB of hard disk space (no need for high-speed SSD disk)
- Docker container engine support
- Docker compose software version 1.21.0 or higher installed
Network flows
During the setup phase, the machine on which the station is running must be able to connect to the internet on port TCP 443 (HTTPS) to download Kadiska’s Docker image from a DockerHub repository. A standard HTTP connection will also be required for the OS updates.
The details of the required flows to get the Docker image are provided in the table below:
| Source | Source ports | Destination | IP protocol | Destination ports | L7 protocol |
|---|---|---|---|---|---|
station host IP |
any | registry-1.docker.io | TCP | 443 | HTTPS |
station host IP |
any | hub.docker.com | TCP | 443 | HTTPS |
station host IP |
any | production.cloudflare.docker.com | TCP | 443 | HTTPS |
station host IP |
any | docker-pinata-support.s3.amazonaws.com | TCP | 443 | HTTPS |
station host IP |
any | cdn.auth0.com | TCP | 443 | HTTPS |
station host IP |
any | login.docker.com | TCP | 443 | HTTPS |
station host IP |
any | auth.docker.io | TCP | 443 | HTTPS |
Once the station is installed, it has to communicate with our platform to authenticate and register. To perform this, an HTTPS connection (port TCP 443) is required to the destination https://app.kadiska.com.
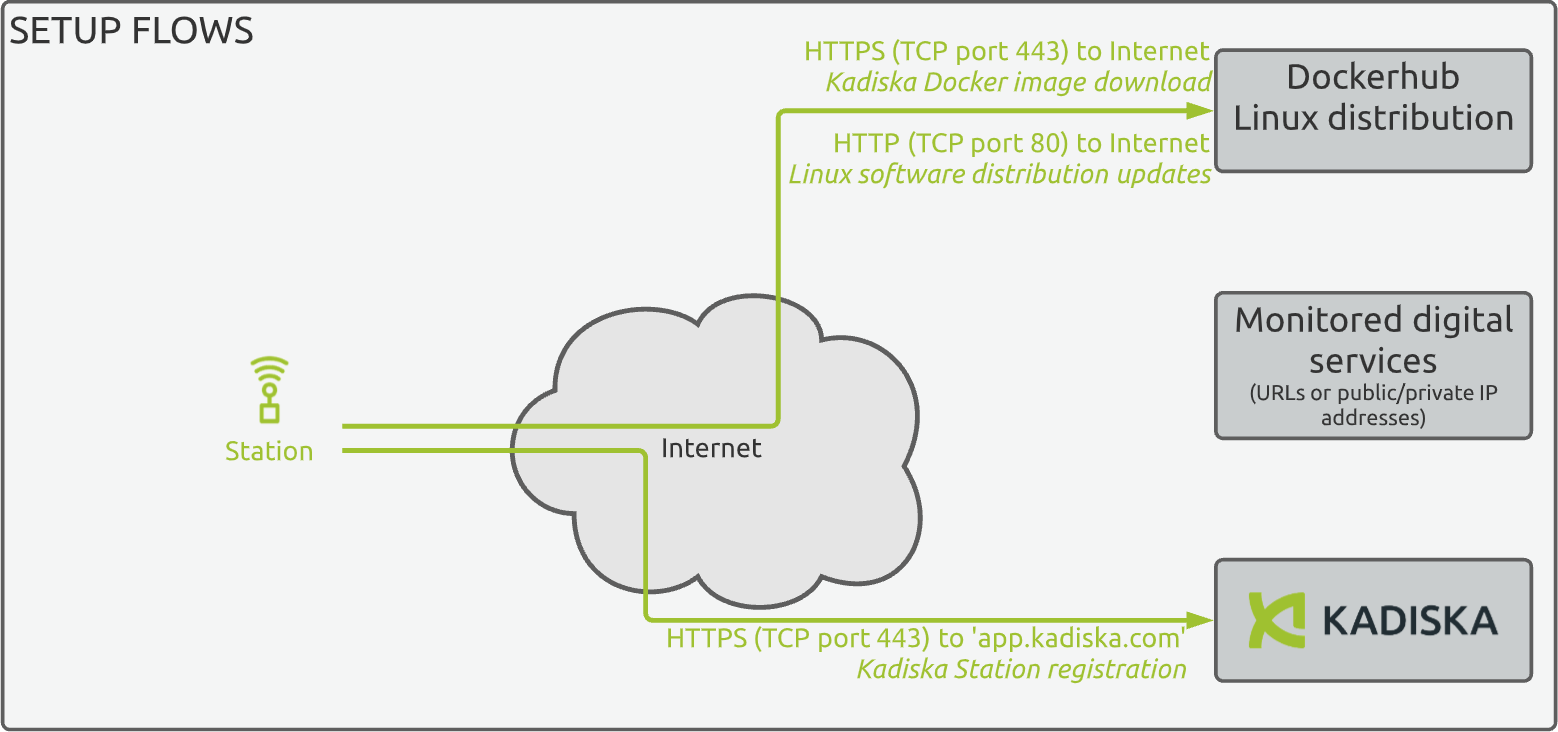
The egress traffic to allow is the following:
| Source | Source ports | Destination | IP protocol | Destination ports | L7 protocol |
|---|---|---|---|---|---|
station host IP |
any | app.kadiska.com | TCP | 443 | HTTPS |
In case you need Kadiska to provide technical support, ingress SSH (TCP port 22) is required. This implies the Enterprise Station to have a public IP address or to use port mapping to make it reachable. This access can be activated on-demand, only when support is required.
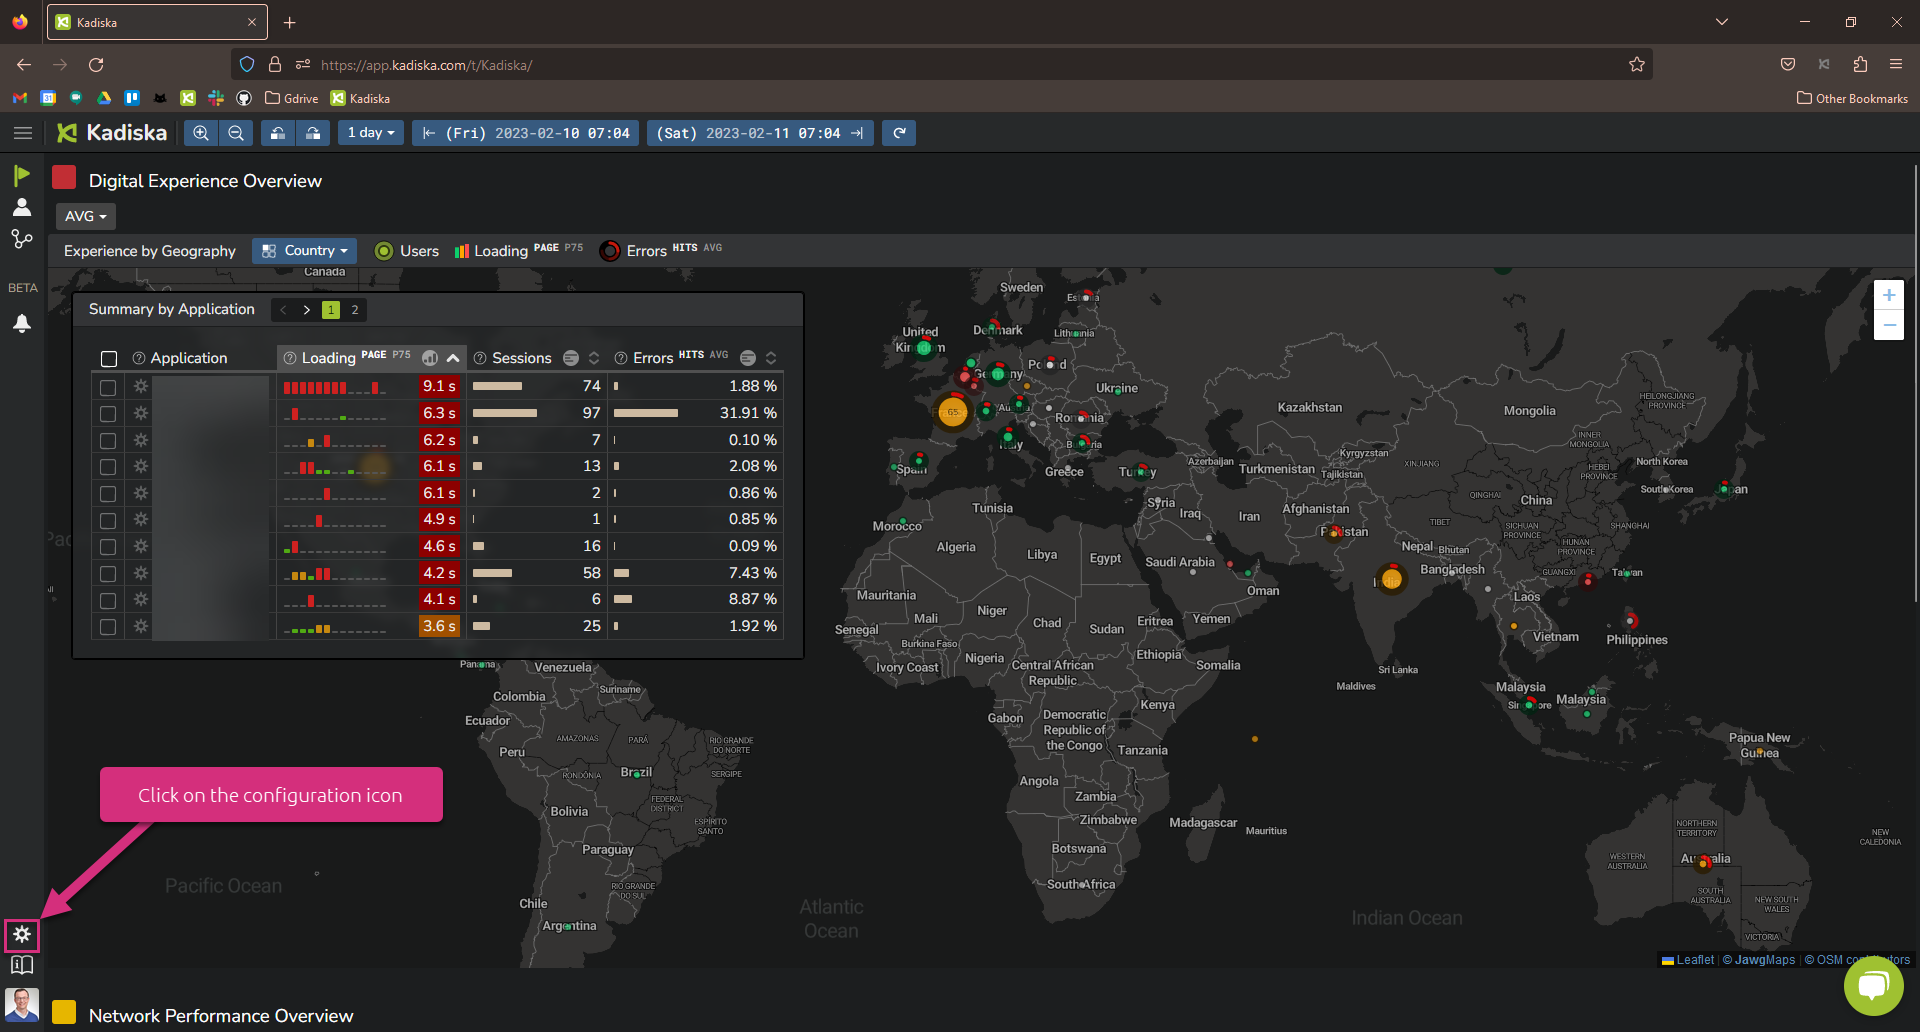
Step 1: Enterprise Station creation
Once you have access to the Kadiska platform, login and click on the “Configuration” icon:
By default, you're directed to the "Watchers" configuration page. Click on "Testers" to go the Kadiska Testers configuration page.
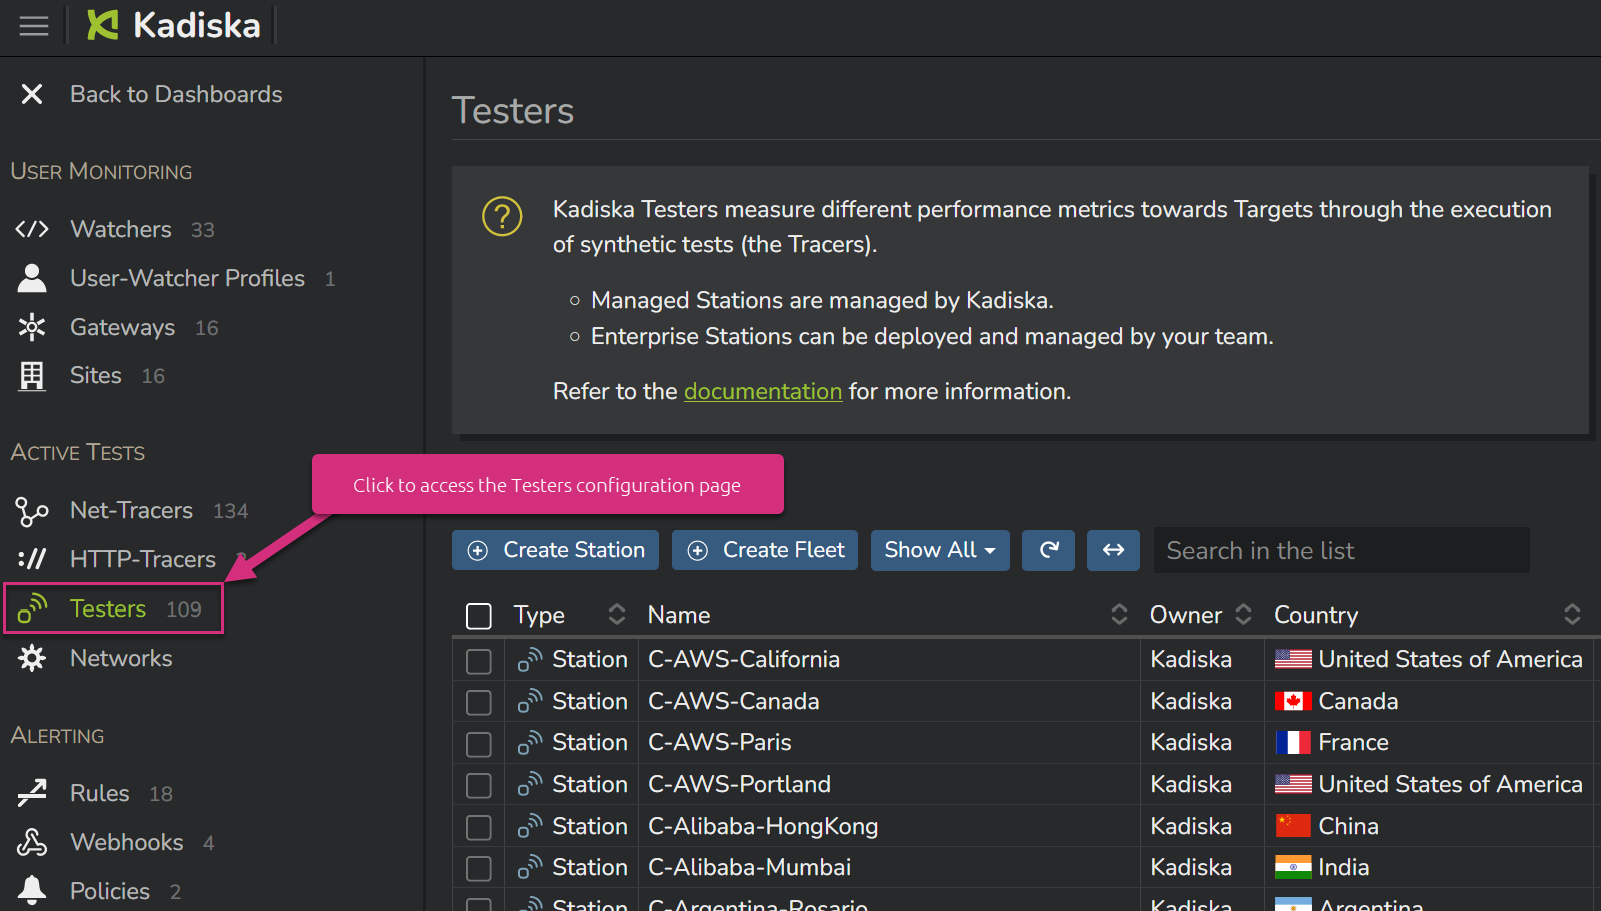
On your screen, you may already see a list of managed Stations that we publicly provide access to.
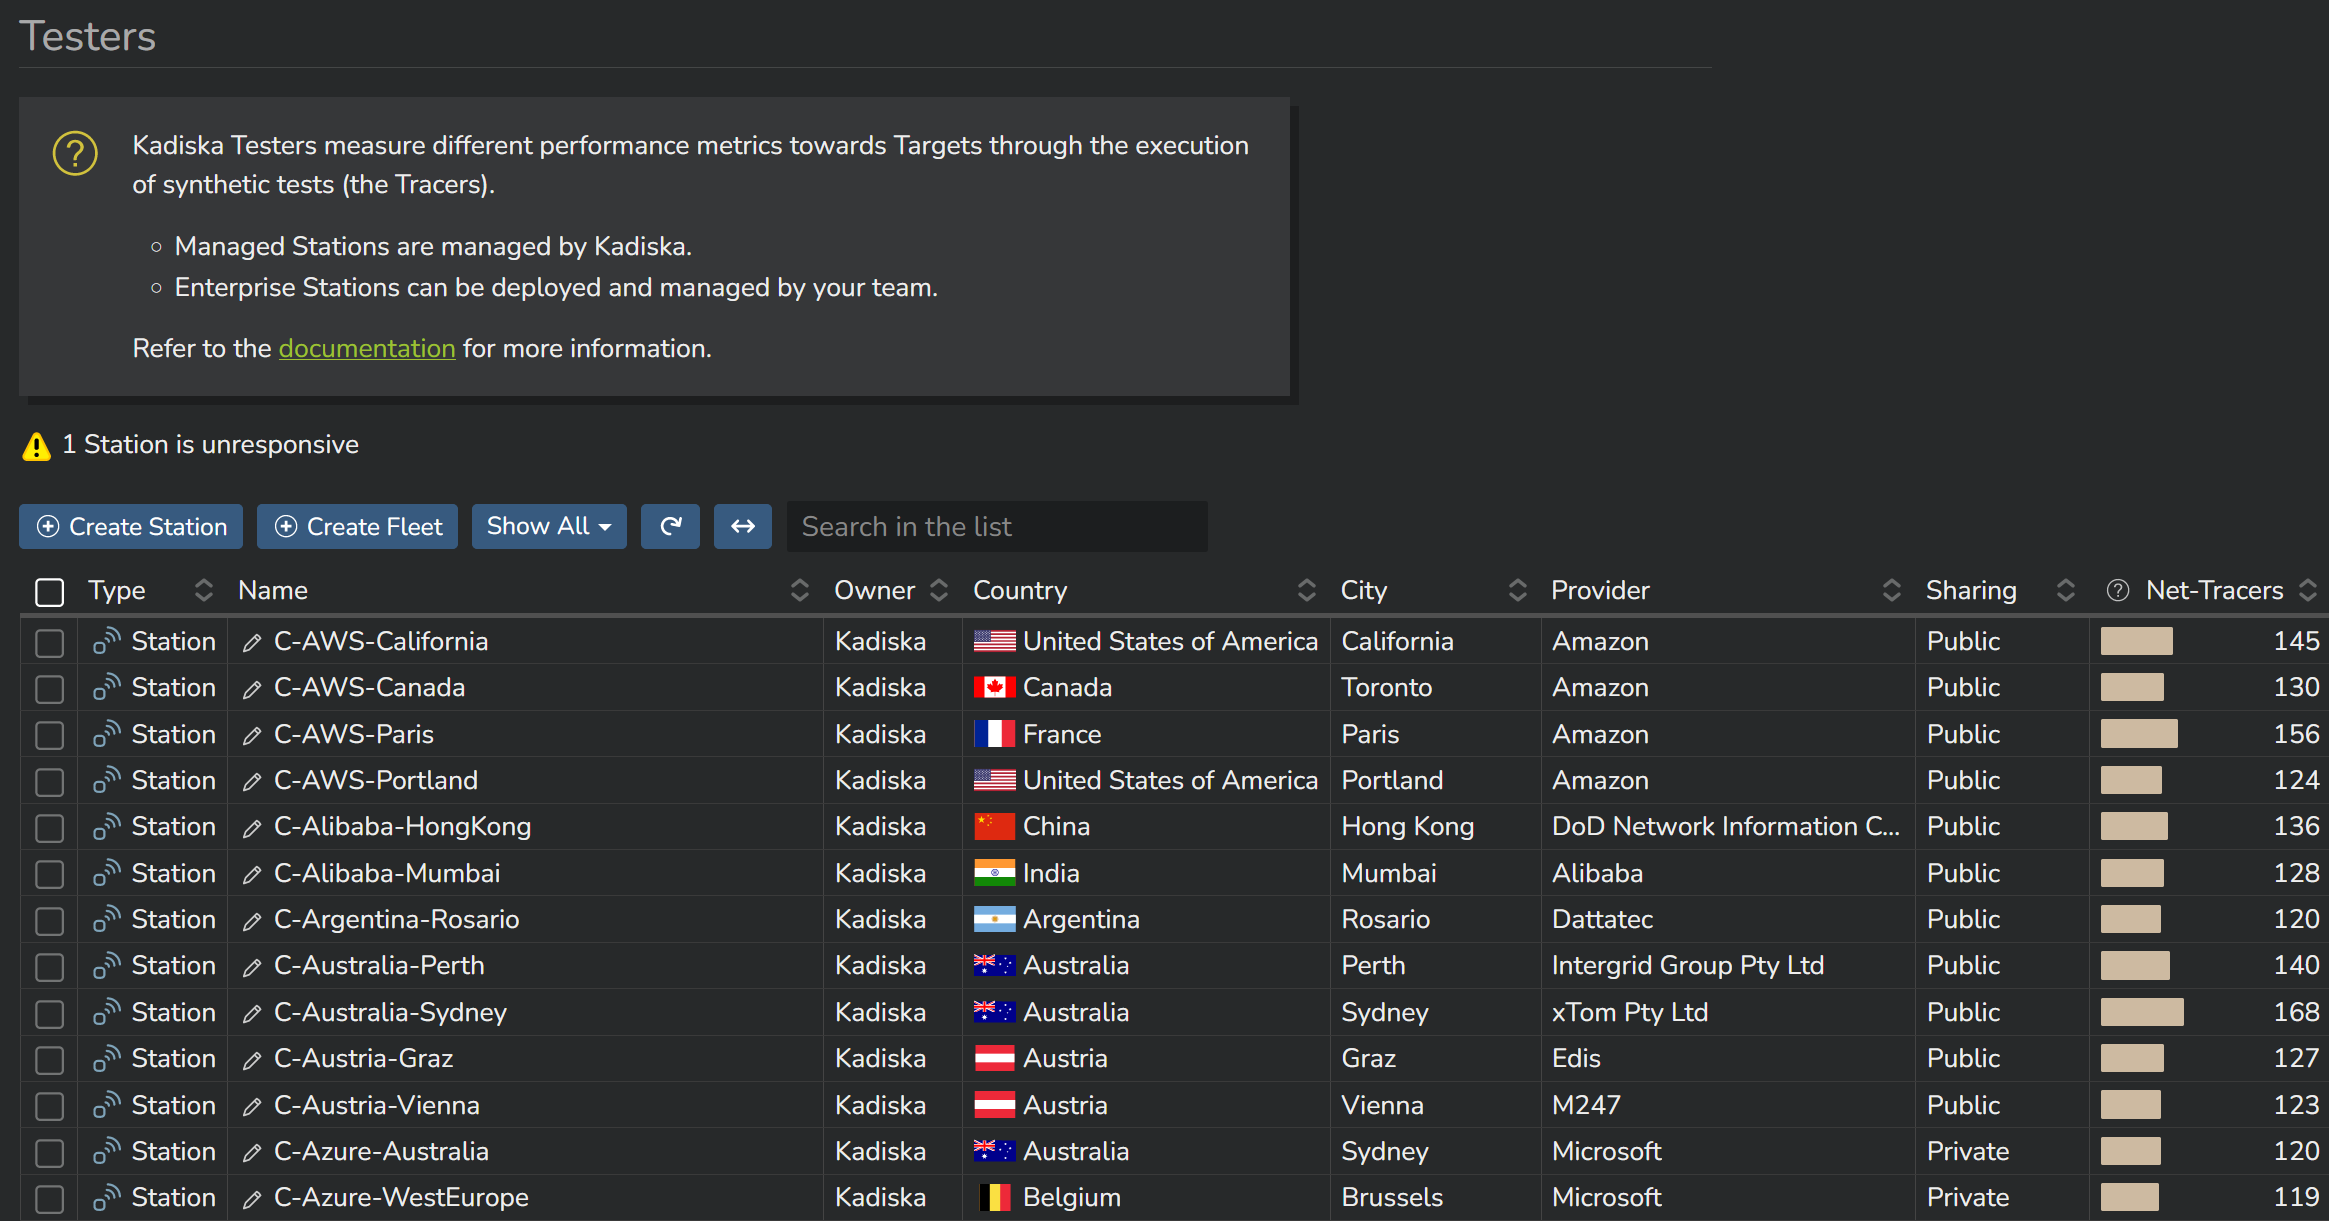
You can deploy your own Station(s) by first clicking on the button "Create Station".
General section
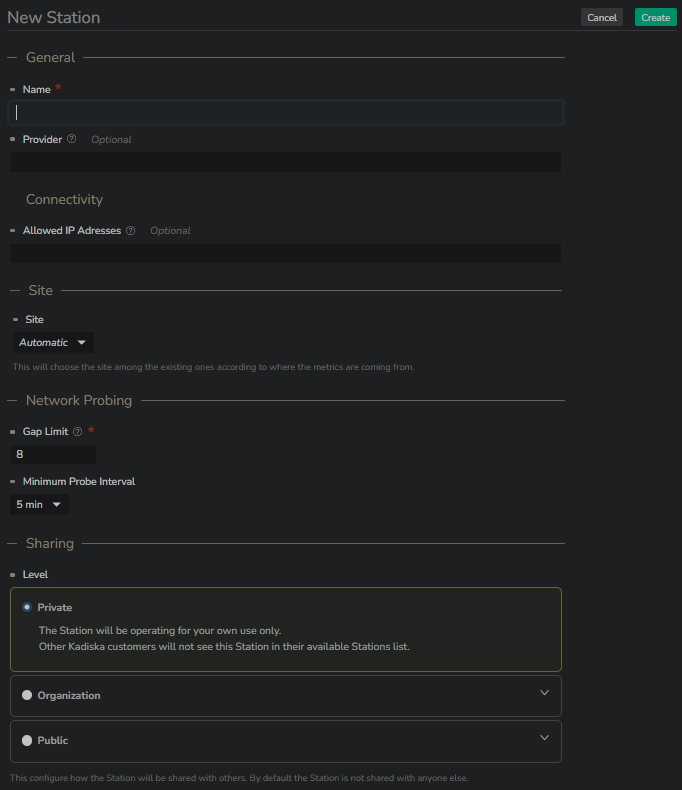
As you can notice, creating an Enterprise Station can be limited to providing a name!
The "Provider" and "Allowed IP Addresses" fields are optional.
When you leave the "Allowed IP Addresses" empty, it will automatically match your Enterprise Station public IP address discovered during the registration step (see below).
Site section
In case your Enterprise Station is supposed to remain on a specific location, you can link it to one of your configured sites.
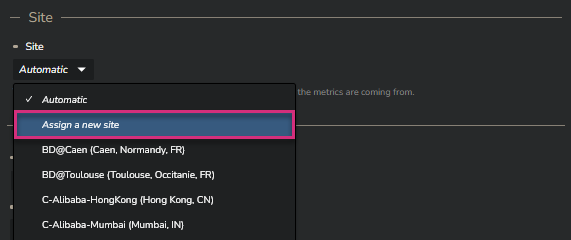
In case you have not configured the site you need to link the Enterprise Stations to yet, then you can create a new one directly from the Enterprise Station configuration menu.
Select "Assign a new site" from the dropdown list:
If your Station is supposed to move from one location to another, you can leave the site configuration to "Automatic", which is proposed by default.
In this case, the Enterprise Station will be automatically located based on its IP addressing scheme and the existing sites and gateways configurations.
Please refer to the Sites and Gateways section for more information about the sites and the gateways.
Network Probing section
"Gap Limit" corresponds to the maximum number of consecutive hops that cannot be identified (no response to Tracer tests) before aborting the Tracer test. It prevents a Tracer to indefinitely try to reach a target that will never respond. The default value is 8. In case you are dealing with really complex network architectures, this value may need to be increased. The maximum value is 16.
If the Tracer does not discover any node and does not reach the target, no data will be reported in the Kadiska platform.
"Minimum Probe Interval" lets you set the minimum interval between consecutive tracer tests at the Enterprise Station level. By default, the minimum interval is 5 minutes, but it can be reduced to 1 minute in case your Enterprise Station will be required to perform more granular tests.
In case you set it to 5 minutes and you configure a Net-Tracer with an interval of 1 minute, the Enterprise Station configuration will take precedence.
Sharing
Sharing preferences are selected from the "Sharing" dropdown menu:
| Sharing option | Description |
|---|---|
| public | Your Station will be visible by all other Kadiska customers |
| organization | Your Station will only be visible to your own organization (multiple tenants) |
| private | Your Station will only be visible to you (active tenant) |
Click on "Create" to confirm your settings. The Station is now created but is not activated yet.
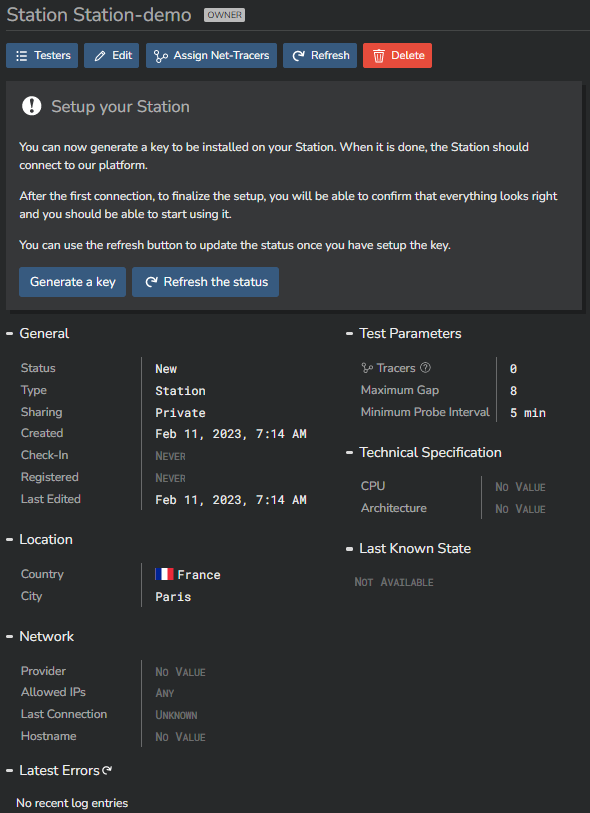
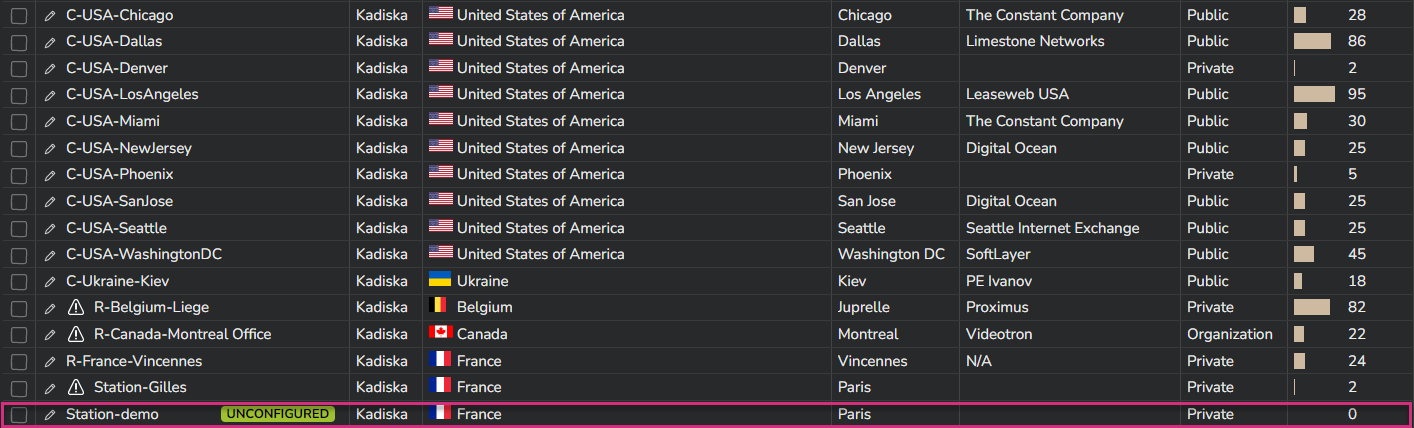
If you go to the list of available Stations (button "Back"), you can see the newly created Station and its status ("unconfigured").
To come back in the Station configuration menu, just click on its name from the list. For obvious security reasons, each Station has to authenticate to the Kadiska platform. This is done through an API Key. Click on the "Generate a key" button.
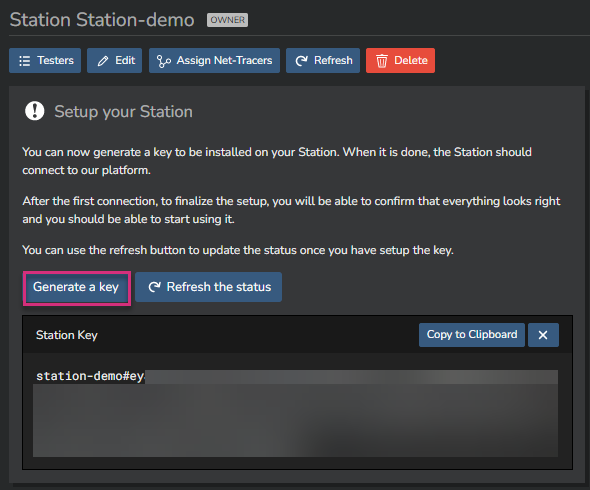
You’ll use this API key later, when deploying the docker container.
Step 2: Enterprise Station deployment
Automated installation
The easiest way to deploy a Kadiska Enterprise Station is by using an installation script.
In this case, you only have to provision a machine running a Linux operating system complying with the minimal technical requirements mentioned above.
The following operating systems are supported:
| Operating System | Supported releases |
|---|---|
| Debian/Raspbian | Release 10 and higher |
| Ubuntu | Release 18.04 and higher (LTS only) |
| RHEL/Centos/Rocky | Release 7 and higher |
| openSUSE Leap | Release 15.3 and higher |
Once this is done, you just have to issue the following command to launch the installation script:
- For Debian, Raspbian and Ubuntu:
- For RHEL, Centos, Rocky and openSUSE:
During the installation process, you'll be prompted to provide the Enterprise Station API Key you have created during the step 1 of the deployment.
Optionally, you can provide the parameters to connect the Station through a proxy (login/pwd or certificate). See next section for more details.
Manual installation
Before manually deploying the Station container, make sure the host on which you’ll deploy it contains a Docker engine.
Then install docker-compose in version 1.21.0 or higher.
Once this is done, create the following docker-compose.yml file (for example in a /srv/kadiska/ folder).
version: '3'

services:
  # Kadiska Station
  kd-station:
    image: "kadiska/kd-station"
    environment:
      KD_LOG_LEVEL: INFO
      KD_STATION_API_KEY: "YOUR KEY HERE"
    labels:
      com.centurylinklabs.watchtower.enable: true
    restart: unless-stopped

  # Upgrade the station periodically
  watchtower:
    image: "containrrr/watchtower"
    volumes:
      - /var/run/docker.sock:/var/run/docker.sock
    environment:
      WATCHTOWER_LABEL_ENABLE: 1
      WATCHTOWER_POLL_INTERVAL: 3600
      WATCHTOWER_CLEANUP: 1
      WATCHTOWER_INCLUDE_RESTARTING: 1
      WATCHTOWER_INCLUDE_STOPPED: 1
      WATCHTOWER_REVIVE_STOPPED: 1
    restart: unless-stopped
Now you can launch the Station.
Do not forget to replace the KD_STATION_API_KEY variable provided in the example above by your own key.
$ cd /srv/kadiska/
$ docker-compose up -d
$ docker-compose ps
      Name            Command       State    Ports
----------------------------------------------------
srv_kd-station_1   /entrypoint.sh   Up
srv_watchtower_1   /watchtower      Up      8080/tcp
Both services must be Up.
Using a proxy
You can configure the Station so that it connects through a proxy.
Only the HTTP(S) traffic will obviously pass through the proxy. This corresponds to:
- fetching the Station configuration
- updating the Station software version
- sending the collected performance metrics to the Kadiska platform
If the HTTPS traffic required to download the docker image from DockerHub must pass through the proxy, this must be configured at the machine OS level. The traffic generated by the Tracer tests themselves does not go through the proxy.
Simple login/pwd authentication
A simple login and password based authentication can be configured by adding the following environment variable to both the Station and Watchtower containers:
Using a certificate chain
You can connect Kadiska Enterprise Stations through proxies that perform HTTPS decryption.
For this you need to import the certification chain in the Station, and Watchtower container.
This is done in the volumes sections, and with environment variables PROXY_CERTS_FILE and https_proxy.
The template of the docker-compose.yml file looks like this:
version: '3'

services:
  # Kadiska Station
  kd-station:
    image: "kadiska/kd-station"
    volumes:
      # Replace /PATH/TO/YOUR-CERTIFICATE-HERE.pem by the path to the proxy certificate chain
      - /PATH/TO/YOUR-CERTIFICATE-HERE.pem:/opt/kadiska/proxy.pem:ro
    environment:
      KD_LOG_LEVEL: INFO
      KD_STATION_API_KEY: "YOUR KEY HERE"
      https_proxy: "http[s]://user:pass@proxy-address:port"
      PROXY_CERTS_FILE: "/opt/kadiska/proxy.pem"
    labels:
      com.centurylinklabs.watchtower.enable: true
    restart: unless-stopped

  # Upgrade the station periodically
  watchtower:
    image: "containrrr/watchtower"
    volumes:
      # Replace /PATH/TO/YOUR-CERTIFICATE-HERE.pem by the path to the proxy certificate chain
      - /PATH/TO/YOUR-CERTIFICATE-HERE.pem:/etc/ssl/certs/proxy.pem:ro
      - /var/run/docker.sock:/var/run/docker.sock
    environment:
      https_proxy: "http[s]://user:pass@proxy-address:port"
      WATCHTOWER_LABEL_ENABLE: 1
      WATCHTOWER_POLL_INTERVAL: 3600
      WATCHTOWER_CLEANUP: 1
      WATCHTOWER_INCLUDE_RESTARTING: 1
      WATCHTOWER_INCLUDE_STOPPED: 1
      WATCHTOWER_REVIVE_STOPPED: 1
    restart: unless-stopped
The path /PATH/TO/YOUR-CERTIFICATE-HERE.pem above must be replaced by the path to the proxy certificate chain.
Certificates can be provided as a bundle containing multiple consecutive certificates. The required format is the following:
-----BEGIN CERTIFICATE-----
your_certificate_1
-----END CERTIFICATE-----

-----BEGIN CERTIFICATE-----
your_certificate_2
-----END CERTIFICATE-----
etc..
Enable IPv6 support
By default, IPv6 support is not enabled. You can activate it as follows.
Make sure that your host and network are IPv6 compatible.
Add this configuration to the Docker daemon configuration file /etc/docker/daemon.json. (Create the file if it does not exist):
{
  "ipv6": true,
  "ip6tables": true,
  "experimental": true,
  "fixed-cidr-v6": "fd00:6B61:6469:736B:6100::/80"
}
Restart the docker daemon:
Modify your docker-compose.yml file, with these changes:
version: '3'

services:
  kd-station:
    image: "kadiska/kd-station"
    [...]
    networks:
      - netipv6

  watchtower:
    image: "containrrr/watchtower"
    [...]
    networks:
      - netipv6

networks:
  netipv6:
    enable_ipv6: true
    ipam:
      config:
        - subnet: fd02:ffff::/64
Note the addition of a network for both images, and the declaration of this network below.
You can restart the Station:
$ cd /srv/kadiska/
$ docker-compose down
$ docker-compose up -d
$ docker-compose ps
      Name            Command       State    Ports
----------------------------------------------------
srv_kd-station_1   /entrypoint.sh   Up
srv_watchtower_1   /watchtower      Up      8080/tcp
Step 3: Enterprise Station activation
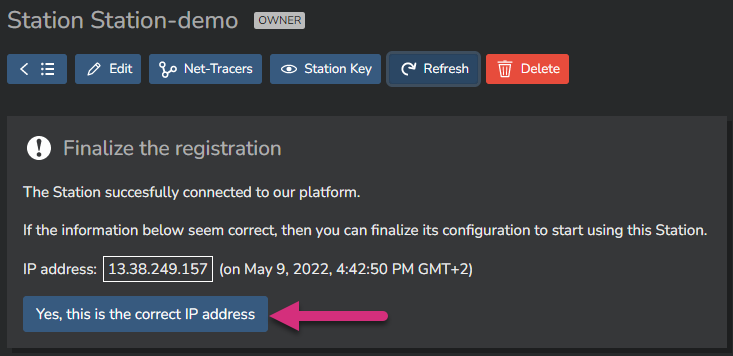
If the deployment is successful, you will see the deployed Station's public IP address. Check it and confirm the Station registration by clicking on "Yes, this is the correct IP address".
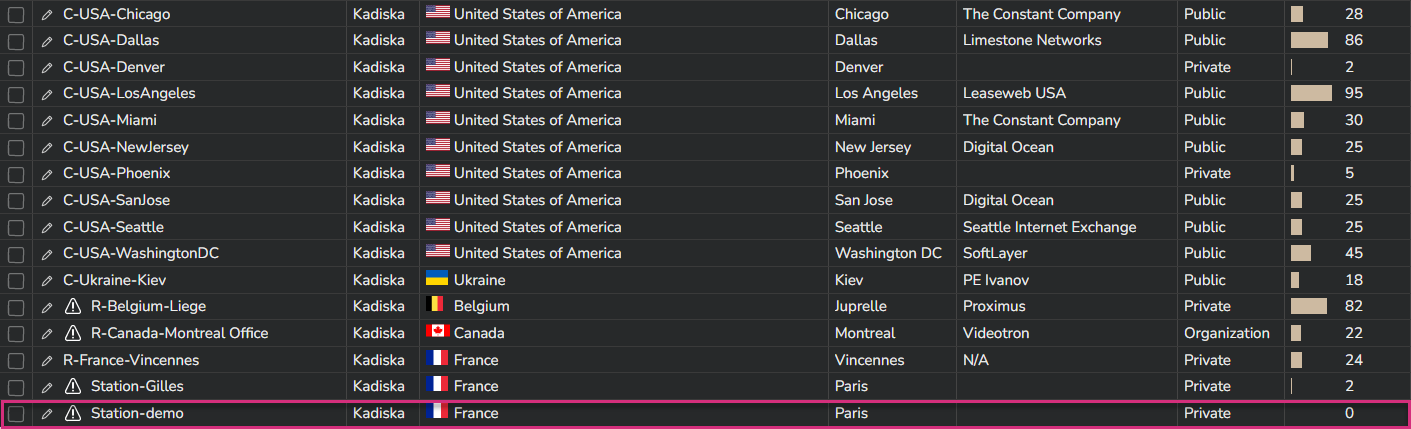
Now your Station is fully activated and ready to perform Tracer tests.
Troubleshooting
In case your Enterprise Station does not operate as expected, the first step to troubleshoot the issue consists of analysing the docker-compose logs.
Connect to your Station in SSH, go to the folder containing your docker-compose.yml file and issue the following command:
Send the output to our CSM (Customer Success Management) team (csm@kadiska.com) for further analysis and guidance.
You can also try to rebuild the Station.
From the folder containing the docker-compose.yml file, issue the following command:
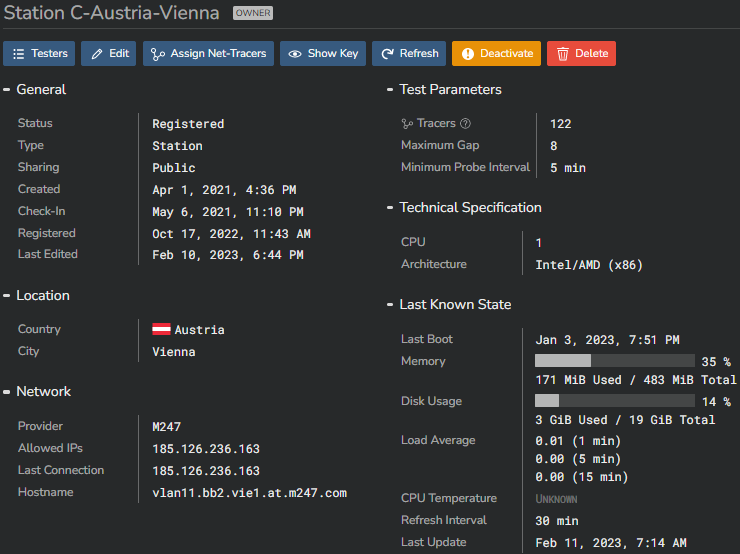
Disabling a Station
If you want to temporarily deactivate a Station without deleting it, you can do it by clicking on the "Deactivate" button in the Station's configuration menu.
The Station can be reactivated at any time. The corresponding Tracers will be automatically reassigned and launched.